
Figure 2.
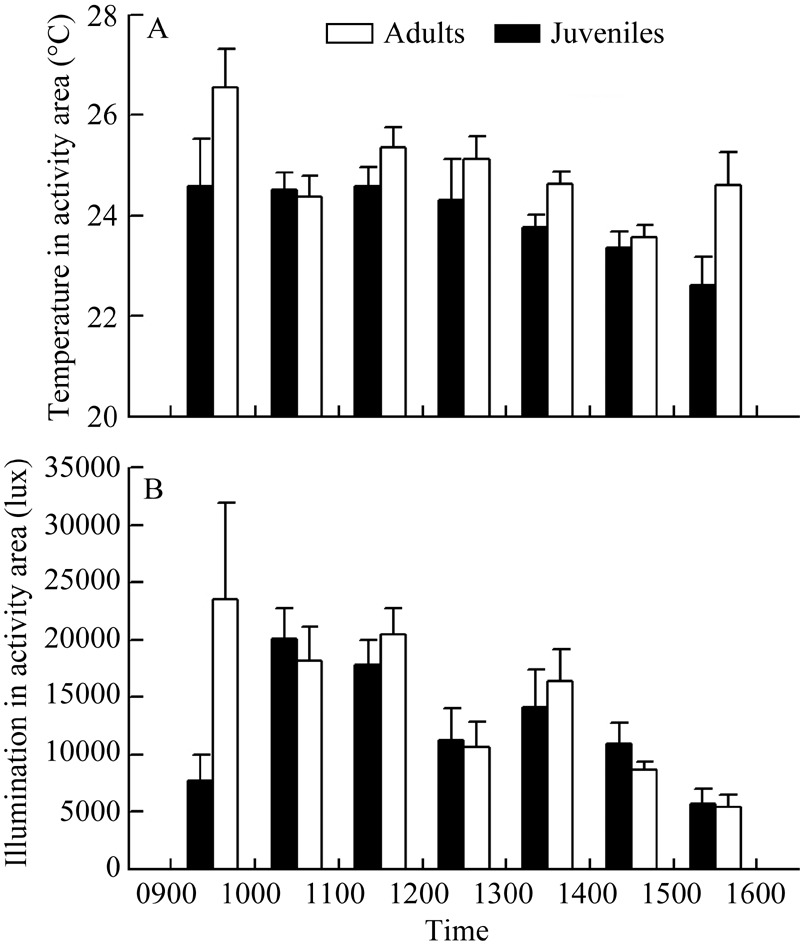
Environmental temperature (A) and illumination intensity (B) of areas where Sphenomorphus indicus are active over different survey times
Official websites use .gov
A
.gov website belongs to an official
government organization in the United States.
Secure .gov websites use HTTPS
A lock (
) or https:// means you've safely
connected to the .gov website. Share sensitive
information only on official, secure websites.
Environmental temperature (A) and illumination intensity (B) of areas where Sphenomorphus indicus are active over different survey times