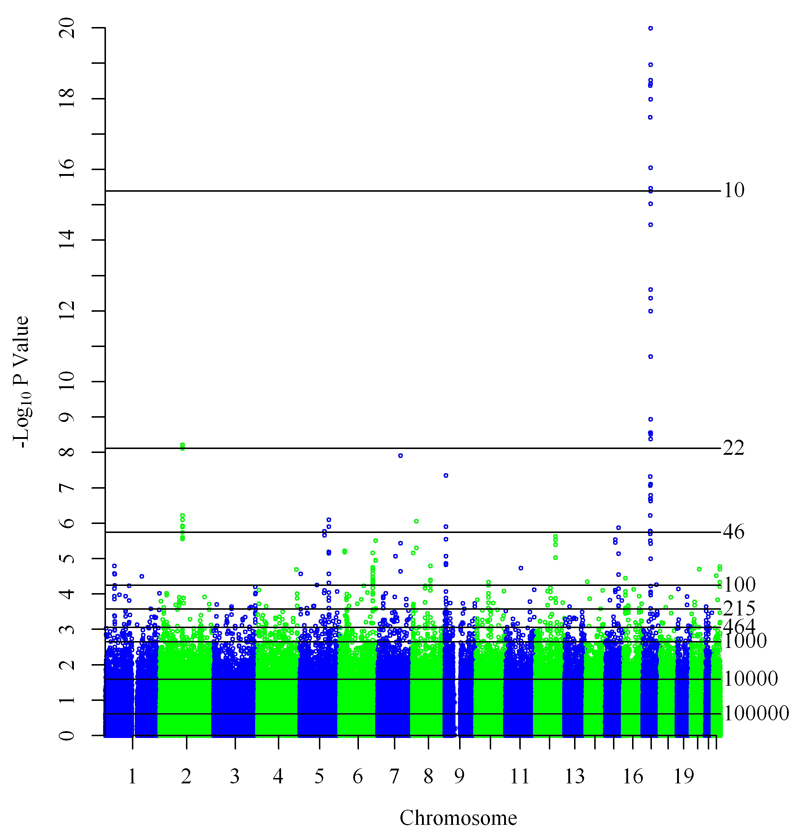
Figure 1. Manhattan plot of pooled results for physician diagnosed asthma in GABRIEL childhood cohorts excluding ALSPAC.
Horizontal lines represent genetic prediction scores with varying number (shown to the right of each line) of included SNPs. All SNPs with P-values above a line are included in the respective score.

