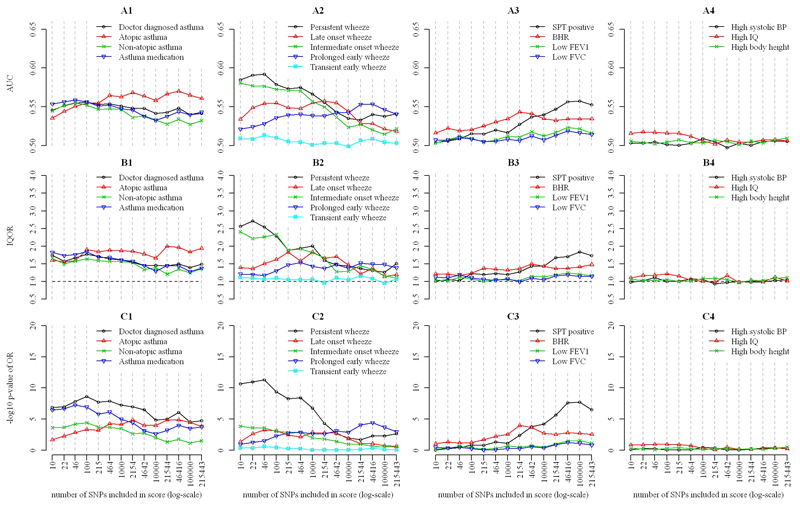
Figure 2. Comparison of predictive value of allelic log-odds scores for the defined outcomes in mid-childhood.
Data: area under ROC curve (AUC) (sub-figures A), inter-quartile odds ratio (IQOR) (B) and P-values for association (C). Outcomes: outcomes based on a physician’s diagnosis (A1-C1), phenotypes of wheeze in the first seven years of life (A2-C2), physiological measurements (A3-C3), and non-asthma outcomes (A4-C4). SNPs included in inverse order of their P-values in an independent GWAS for physician diagnosed asthma.

