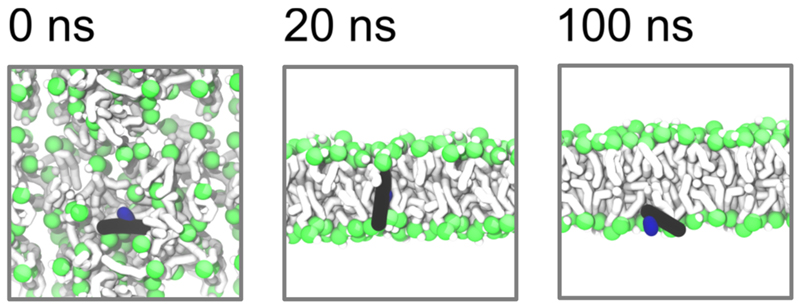
Figure 4.
Dynamics of a single helix insertion simulation illustrated for an L11 helix (see main text and Table 1). Snapshots are shown from a single simulation pipeline at 0, 20 and 100 ns. Lipids are rendered as grey tubes with green spheres for phosphate particles. The helix backbone is rendered as a black tube, and the arginine sidechain rendered in blue. At 20 ns a bilayer has formed, with the peptide in a transmembrane orientation, but between 20 and 100 ns the helix exits the bilayer and remains interfacial for the remainder of the simulation. The entire trajectory is shown in the Supporting Information Movie 1.

