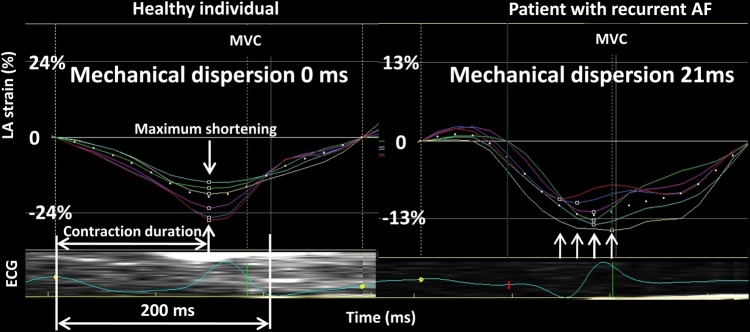
Figure 2.
Strain curves and MD from the left atrium during atrial systole in a healthy individual (left panel) and a patient with PAF (right panel) but in sinus rhythm during the study. Horizontal white arrow indicates contraction duration defined as the time from peak of the atrial P wave on ECG to maximum myocardial shortening. Vertical arrows indicate the timing of maximum myocardial shortening in each LA segment. Right panel shows more pronounced MD in the patient with PAF. AF, atrial fibrillation; LA, left atrial; MVC, mitral valve closure.

