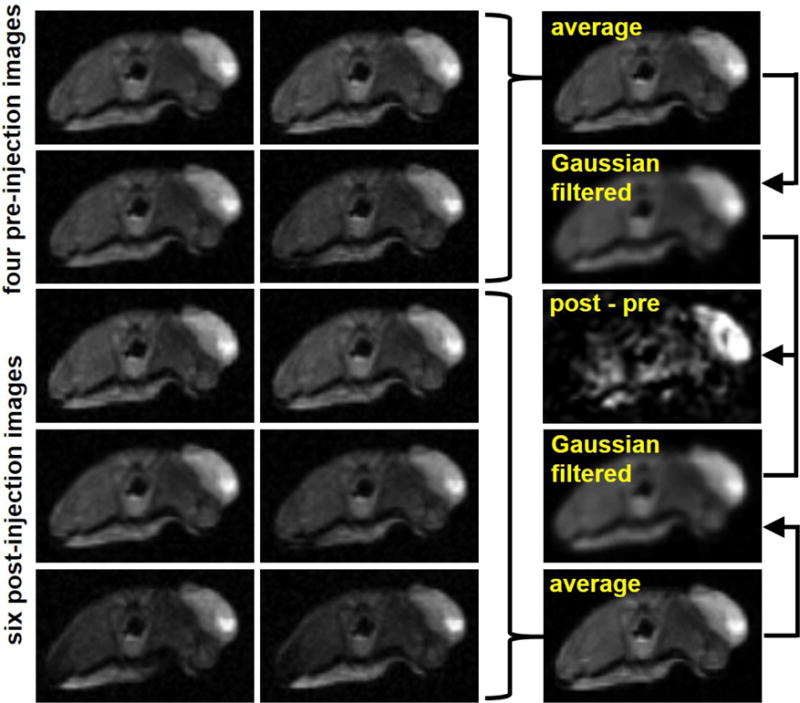
Figure 2.

An outline of CEST image processing. The four pre-injection scans acquired are averaged and then a Gaussian filter is performed. The same process is performed with the six post-injection scans. The average post-injection scan is subtracted from the average pre-injection scan. The CEST spectrum from the remaining difference (post-pre) image is fit to generate pHe of the tumor.
