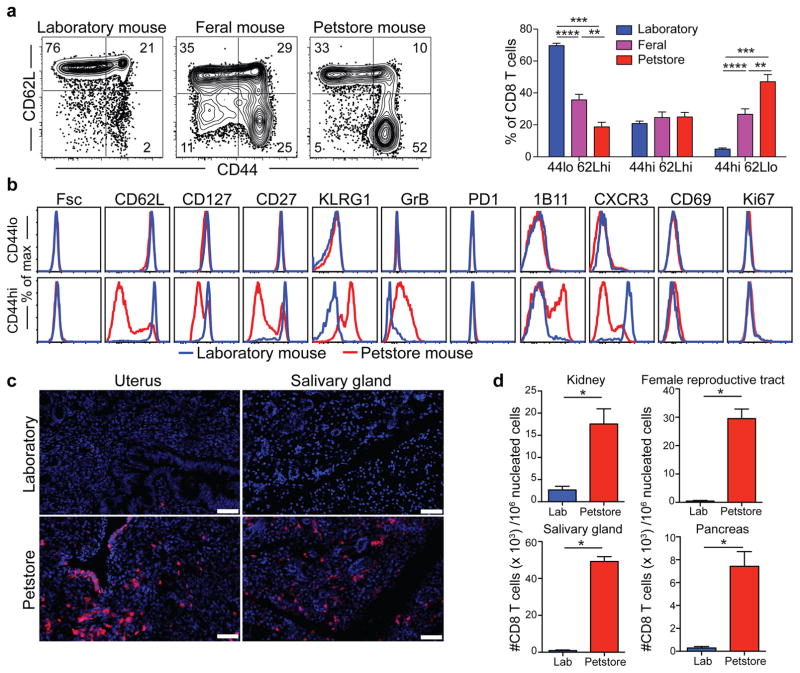
Figure 2. CD8 T cell subsets vary between feral, petstore, and laboratory mice.
a) CD8 T cell subsets were compared in PBMC between laboratory mice (n=9), feral mice that were trapped in the wild (n=10), and mice obtained from a pet store (n=6), among 2 independent experiments. b) Phenotype of CD44lo/CD62Lhi (naïve) and CD44hi (antigen-experienced) CD8+ PBMC was compared by fluorescent flow cytometry. c,d) CD8 T cell density in non-lymphoid tissues was compared between laboratory and pet store mice by quantitative immunofluorescence microscopy (QIM). Immunofluorescence staining of frozen sections of indicated tissues (n=8 animals per group, scale bars = 50 μm). CD8β (red), DAPI (nuclei, blue). Significance was determined using unpaired two-sided Mann-Whitney U-test. * p<0.05, ** p<0.01, *** p<0.001, **** p<0.0001, bars indicate mean ± S.E.M.

