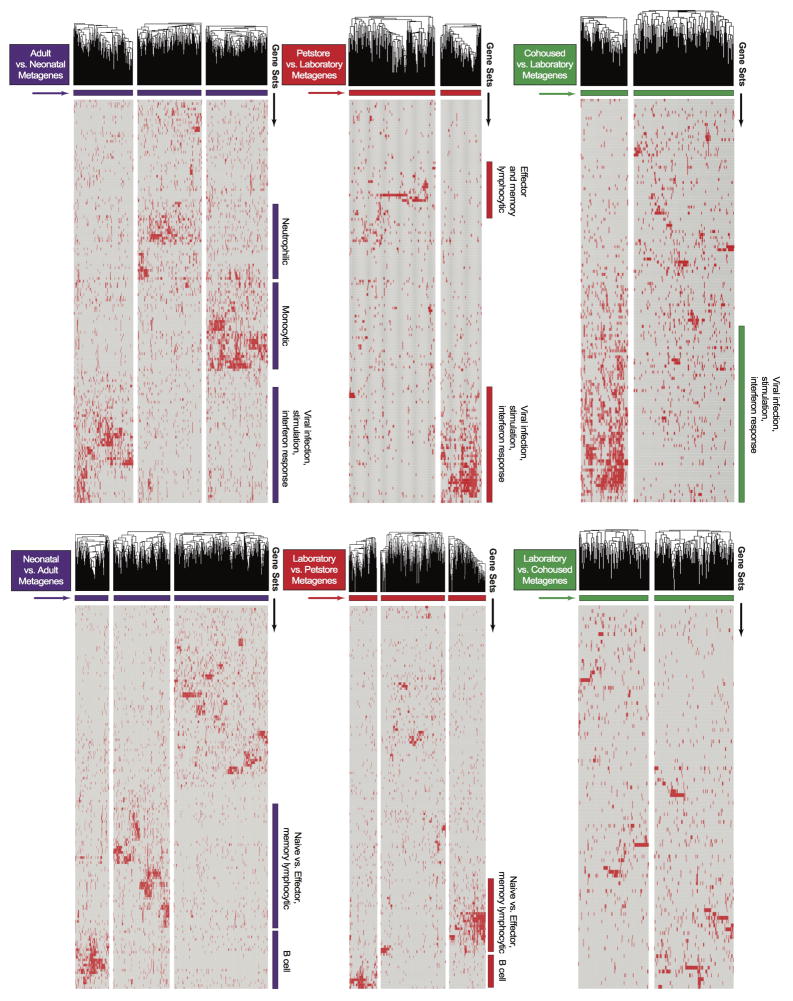
Extended data figure 3.
LEM metagene analysis. For each comparison, standard GSEA was performed using the ImmSigDB database of gene-sets. Genes in the top 150 enriched sets (FDR<0.001, ranked by P-value) were filtered to only leading edge genes and subsequently clustered into groups (metagenes) using an NMF algorithm. Hierarchical clustering of genes within individual metagenes was performed to obtain the final heatmap. Metagenes with qualitatively discernible ‘blocks’ of gene-set membership were annotated according to the identity of corresponding enriched gene-sets. Heatmaps for Adult vs. Neonatal, Petstore vs. Laboratory, Cohoused vs. Laboratory, Neonatal vs. Adult, Laboratory vs. Petstore, and Laboratory vs. Cohoused comparisons are shown. Individual genes within each metagene are listed in Supplemental table 1. Pairwise overlaps between metagenes from different comparisons are visualized in Figure 4c.

