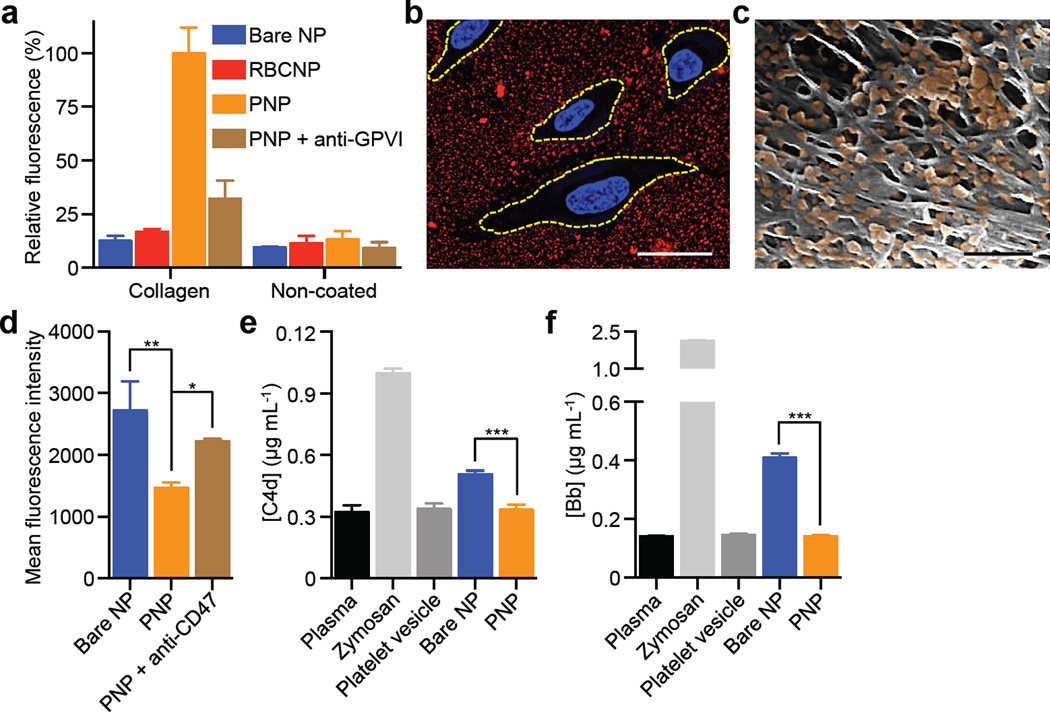
Figure 2. Collagen binding and immunocompatibility.
(a) Fluorescence quantification of nanoparticle retention on collagen-coated and non-coated plates (n=6). (b) Localization of PNPs (stained in red) on collagen-coated tissue culture slides seeded with HUVECs (nuclei stained in blue). Cellular periphery is outlined based on cytosolic staining. Scale bar = 10 µm. (c) A pseudocolored SEM image of the extracellular matrix of a decellularized human umbilical cord artery following PNP incubation (PNPs colored in orange). Scale bar = 500 nm. (d) Flow cytometric analysis of nanoparticle uptake by human THP-1 macrophage-like cells (n=3). (e) Classical complement activation measured by C4d split products and (f) alternative complement activation measured by Bb split products for bare NPs, platelet vesicles, and PNPs in autologous human plasma (n=4). Zymosan and untreated plasma are used as positive and negative controls respectively. All bars represent means ± SD. *P ≤ 0.05, **P ≤ 0.01, ***P ≤ 0.001.

