
Figure 4.
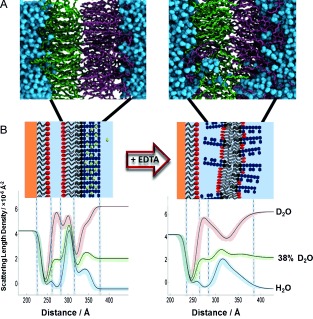
A) MD simulation of an LPS–PC asymmetric bilayer after 500 ns with Ca2+ (left) and 200 ns after replacement of the Ca2+ ions by twice the amount of Na+ ions (right). B) nSLD profiles obtained by fitting the neutron reflectivity data of an asymmetric DPPC/Ra‐LPS system in the presence of 5 mm Ca2+ (left) and after calcium sequestration by EDTA (right). Schematic representations of the structures that these profiles describe are also shown, these were determined through interpretation of the fitting parameters and the resulting SLD profiles using the known scattering length densities of the bilayer components and the aqueous solutions (see the Supporting Information). Note the reduced packing/asymmetry and increased roughness.