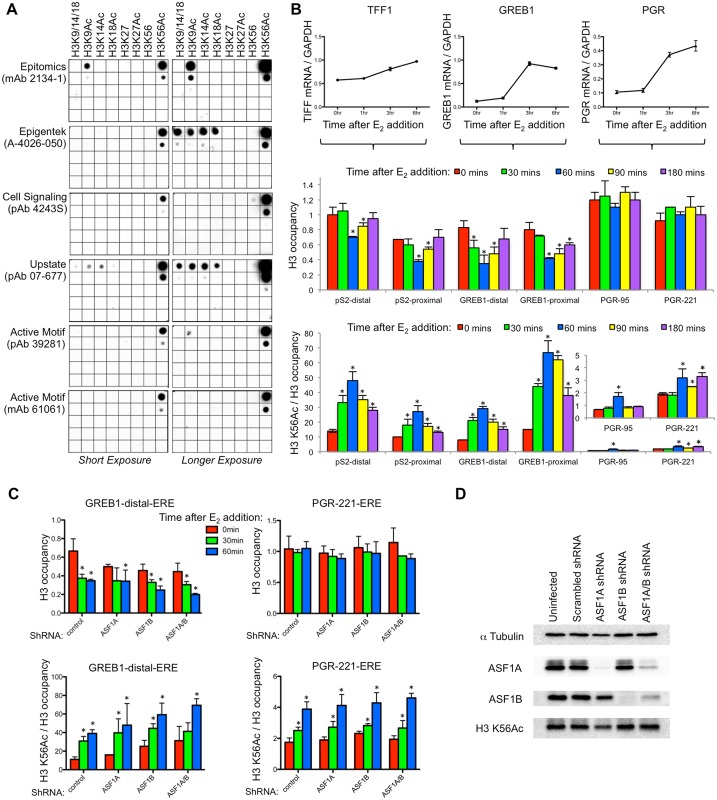
Fig 1. H3 K56Ac is not required for chromatin disassembly gene regulatory regions of estrogen responsive genes.
A. Dot blot analysis of the indicated commercial H3 K56Ac antibodies, the indicated peptides. 10 μl of each peptide at 300 μM concentration was spotted on the top row, followed by 10 fold dilutions below. A short and longer exposure are shown. B. The top shows RT-PCR analysis of mRNA induction at the indicated times after addition of estradiol, normalized to GAPDH. Data are the average and standard deviation of three independent experiments. Below is shown a ChIP analysis of histone H3 occupancy at the indicated time points after estradiol addition from the same time course as the mRNA analysis, at the indicated EREs in the pS2 (TFF1), GREB1, and PGR promoters. Each data point was normalized to the input and a telomeric control region at the same time point. At the bottom is shown a ChIP analysis of histone H3 K56Ac levels normalized to H3 occupancy. Each data point was normalized to the input and a telomeric control region at the same time point. Shown are the average and standard deviation of three independent experiments. The H3 K56Ac data for the PGR gene regions are shown again in the inset with the y-axis expanded, to enable visualization of the very low signal. * indicates significant changes from time 0, p<0.05 measured by the Student’s unpaired t-test. C. ChIP analysis of H3 and H3 K56Ac levels normalized as in B, during the indicated shRNA knockdowns. Shown are the average and standard deviation of three independent experiments. * indicates significant changes from time 0, p<0.05 measured by the Student’s unpaired t-test. D. Western blot analysis of ASF1A, ASF1B, H3K56 Acetylation, and tubulin alpha from samples taken from the experiment shown in C. Protein extracts were made with RIPA buffer from MCF7 cells that were infected with lentivirus of non-silencing (control), ASF1A shRNA, ASF1B shRNA, ASF1A/B shRNA. The Active Motif polyclonal antibody was used for experiments shown in B-D.

