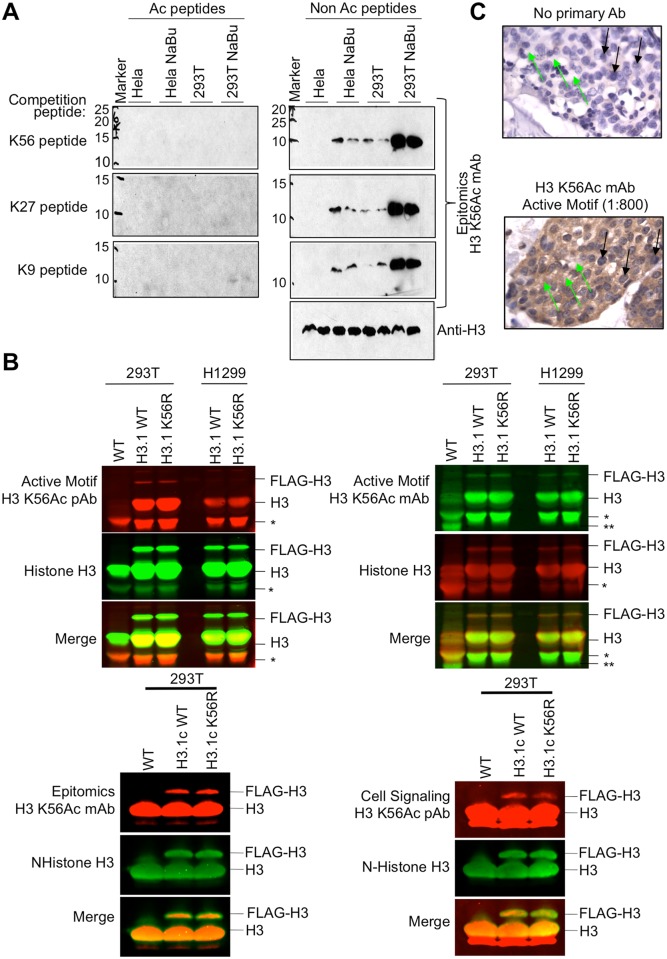
Fig 2. Commercial H3 K56Ac antibodies are non-specific in human cells.
A. Peptide competition analysis using the indicated peptides, of acid extracted histones from HeLa and 293 cells that were treated with or without sodium butyrate (NaBu) to inhibit class I and II HDACs. The antibody used in the western is indicated on the right. Duplicate samples are loaded for each condition. The sizes on the left indicate kD size of Biorad Dual Color Standards molecular weight markers that were transposed onto the film from the membrane. B. Western blot analysis of acid extracted histones from 293 cells that were wild type (WT) or stably expressed H3.1c-FLAG or H3.1c K56R-FLAG, or from H1299 cells that stably expressed H3.1c-FLAG or H3.1c K56R-FLAG. * indicates a proteolytic degradation product of H3 generated by cleavage of the N-terminus that occurs upon generating the total protein extracts. ** indicates a smaller H3 degradation product seen in the wild type sample only, due to over handling of the extract. Data is shown for the Active Motif, the Epitomics and the Cell signalling H3 K56Ac antibodies. C. IHC analysis of the Active Motif mAb, on breast cancer tissue samples shows non-specific cytoplasmic staining instead of distinct nuclear staining. Green arrows point to cytoplasm and black arrows point to nuclei. Both slides are also stained with haematoxylin and eosin (H&E) stain, which stains nuclei blue and eosinophilic structures pink.

