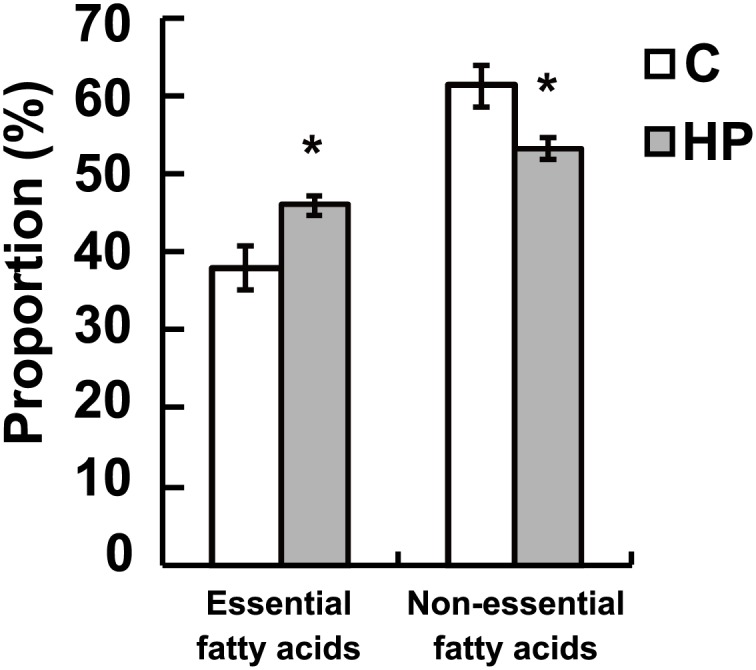
Fig 4. Altered hepatic fatty acid composition in response to the high phosphorous (HP) diet.

Proportions of essential and non-essential fatty acids in the liver. The percent compositions were calculated based on the fatty acid content from 32 detected peaks. Data represent means ± standard error (n = 6). * p < 0.05 vs. control group. C, rats fed the control diet; HP, rats fed the HP diet.
