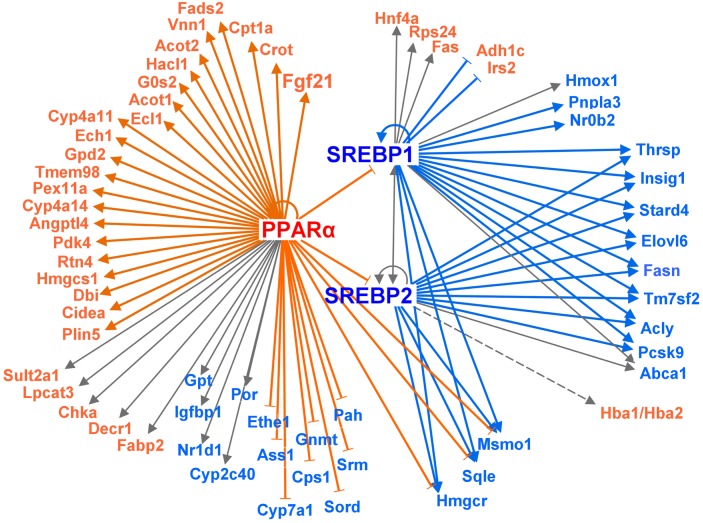
Fig 5. Evaluation of transcription factor activation involved in lipid metabolism.
Enzymes and factors whose mRNA expression is higher and lower in the livers of high phosphorous (HP) diet-fed rats are shown in orange and blue, respectively, in comparison to their expression in the livers of control diet-fed rats. Gray lines indicate that it is unpredictable whether expression of the given enzyme/factor is increased or decreased by the HP diet. Dotted lines indicate indirect regulation. Activation of peroxisome proliferator-activated receptor alpha (PPARα) is predicted to be up-regulated (z-score >2), while activation of SREBP1 and SREBP2 is predicted to be down-regulated (z-score <2).

