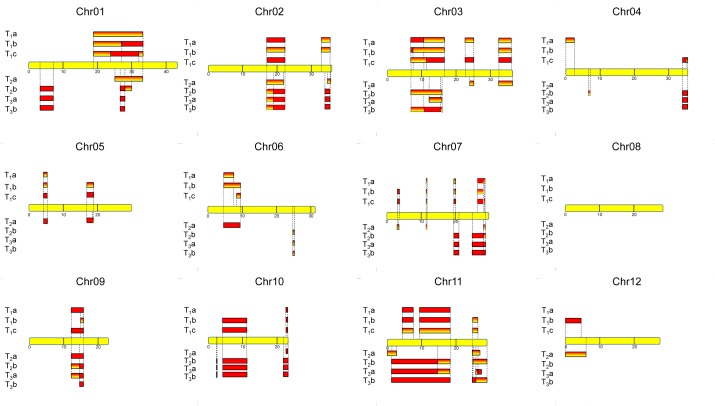
Fig 3. The introgression map of an indica-type genome into all chromosomes.
Introgression into the 12 chromosomes of the TRIM line M0028590. Yellow bar is the TNG67 chromosome, and the numbers indicate the Mb in the chromosome. The introgression regions are revealed by SNPs of 7 plants, including 3 T1 plants, 2 T2 plants and 2 T3 plants. Gradient orange bars, regions with heterozygous SNPs; red bars, regions with homozygous SNPs.

