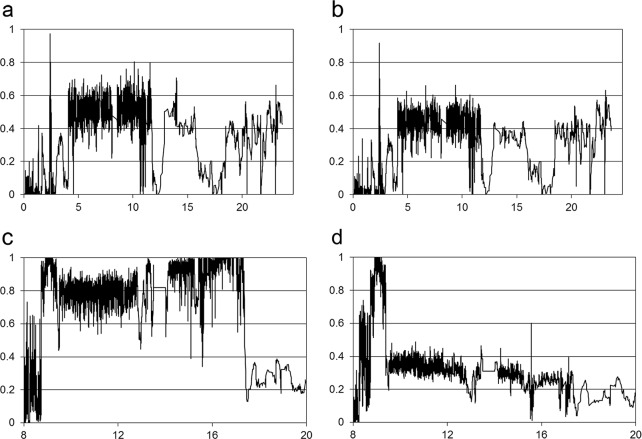
Fig 5. SNP frequency plots for the F2 DNA pools of wild-type or large-grain plants.
(a) and (b) show chromosome 10 for large-grain and wild-type plants, respectively. The lines were plotted as described in Methods. The x-axis value for each averaged SNP frequency was set at a midpoint between the first and fifth SNP, and the y-axis is the position (in Mb) of the chromosome. (c) and (d) show the 8- to 20-Mb region of chromosome 3 for large-grain and wild-type plants, respectively.

