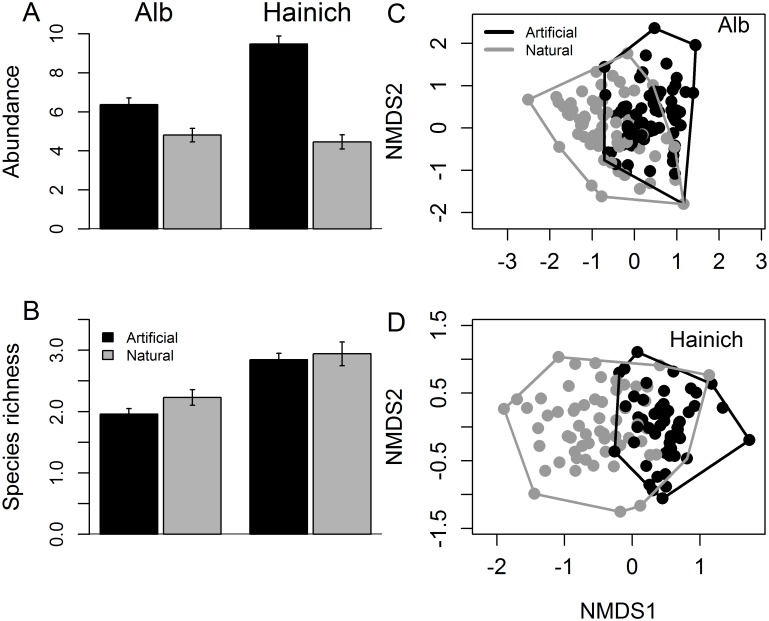
Fig 5. Comparison of macroinvertebrate communities of artificial and natural tree holes in the two regions in June.
A) abundance (square-root transformed), B) species richness and C), D) composition. Artificial holes are depicted by black bars and symbols, natural holes by grey bars and symbols. Average water volume differed between artificial and natural tree holes (artificial tree holes had larger average volume). However, the differences in abundance and richness between artificial and natural tree holes were still significant after fitting water volume as a covariate (for results of statistical analyses see text). Raw abundance and species richness (i.e. not adjusted for differences in volume) are shown here. The low overlap between artificial and natural communities in the composition plots (C, D) shows that community composition differed between artificial and natural tree holes in both regions. Only taxa with more than five occurrences per region across both tree-hole types were used for the nonmetric multidimensional scaling (NMDS) plots in C and D. Stress = 0.17, n = 214 for Alb, stress = 0.21, n = 124, for Hainich. Please note that experimental set-up and the volume of artificial tree holes also varied between the two regions, so they cannot be compared directly.

