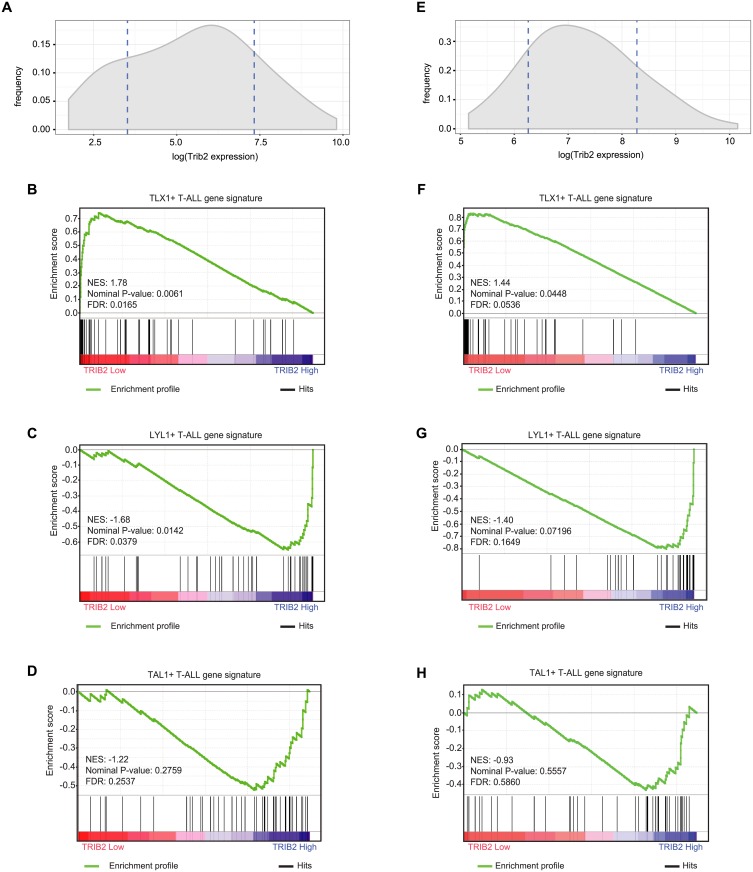
Fig 7. TRIB2 expression correlates with the gene signatures of human early immature and cortical mature T-ALL subtypes.
A) Adult T-ALL samples with low (mean-SD) and high (mean+SD) TRIB2 gene expression (average of 202478_at and 202470_s_at) were identified in the GSE13159 dataset. Dashed lines indicate mean-SD and mean+SD of TRIB2 gene expression. B, C) GSEA analysis shows enrichment of gene signatures of the TLX1+ (B) and LYL1+ (C), but not TAL1+ (D), adult T-ALL molecular subtypes in samples with low and high TRIB2 expression, respectively (FDR < 0.05). E) Pediatric T-ALL samples with low (mean-SD and high (mean+SD) TRIB2 gene expression (average of 202478_at and 202470_s_at) were identified in the GSE26713 dataset. Dashed lines indicate mean-SD and mean+SD of TRIB2 gene expression. F, G) GSEA analysis shows enrichment of gene signatures of the TLX1+ (F) and LYL1+ (G), but not TAL1+ (H), pediatric T-ALL molecular subtypes in samples with low and high TRIB2 expression, respectively (FDR < 0.05). NES, normalized enrichment score.

