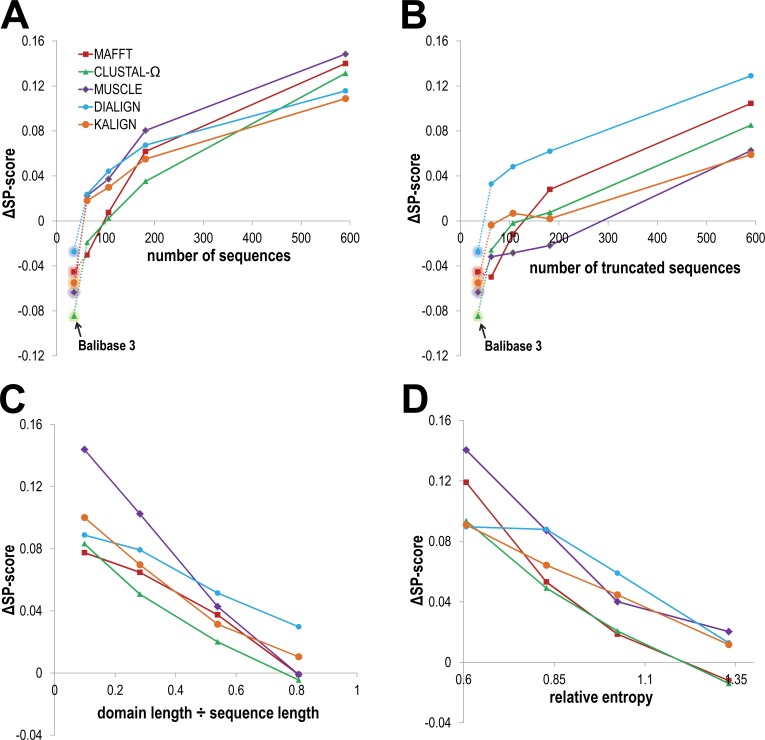
Fig 2. Comparison of GISMO to five other MSA programs.
As described in the text, for each analysis the CDD test sets were first ordered based on the property specified on the x-axis and then split into four equal-sized partitions. The x-coordinates for all data points are averages, for the property in question, over the test sets assigned to the various partitions; similarly, the GISMO ΔSP-scores for each program are averages taken over these partitions. A. GISMO ΔSP-scores as a function of the number of sequences. For comparison, an additional, leftmost set of data points (shown with back-glow) corresponds to 162 out of 218 Balibase 3 test sets; for the remaining 56 Balibase sets, GISMO failed to find a statistically significant alignment presumably due to sparse data: some of these sets have as few as 4 sequences. B.GISMO ΔSP-scores as a function of the number of truncated sequences, as defined in the text. C. GISMO ΔSP-scores as a function of the ratio between the domain length and mean sequence length. For sequence sets with low ratios, the shared domain is more challenging to align due to a larger search space. D. GISMO ΔSP-scores as a function of average relative entropy (with respect to a standard background amino acid distribution and expressed in nats, with 1 nat = 1/ln(2) bits) over all column positions in each benchmark MSA; sequence diversity can be understood as inversely related to relative entropy. For sequence sets with low relative entropy, the shared domain is more difficult to align due to weaker conservation.

