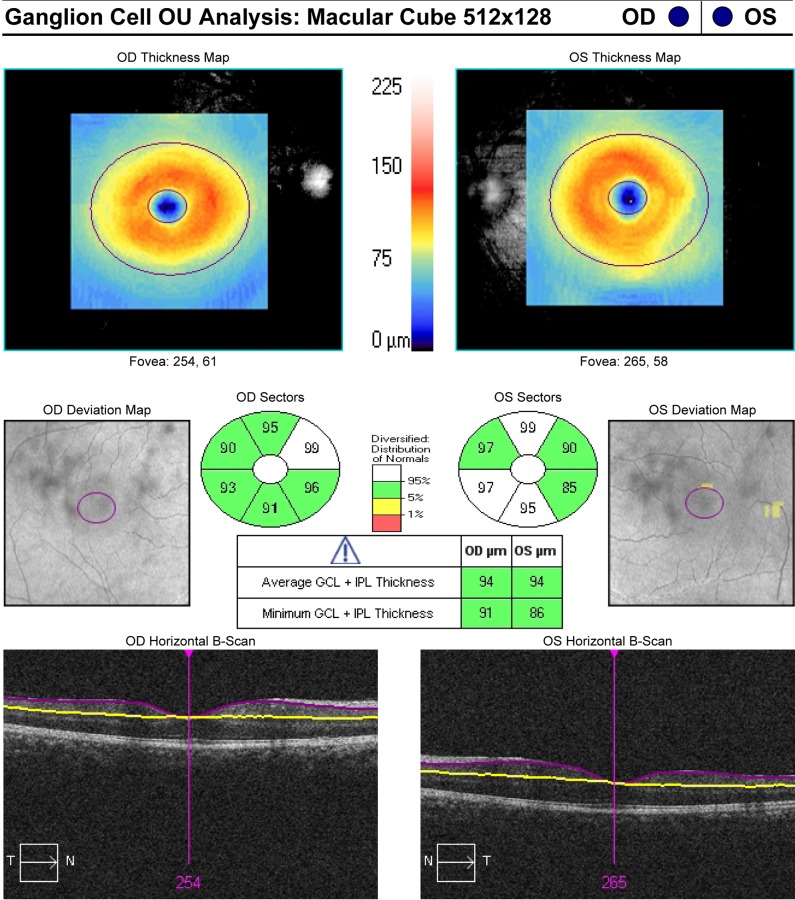
Fig 1. Example of macular ganglion cell inner plexiform layer (GCIPL) thickness measurement as determined automatically by optical coherence tomography: (Top maps) macular GCIPL thickness maps.
Sectoral maps shows macular GCIPL thicknesses at superotemporal, superior, superonasal, inferonasal, inferior, and inferotemporal sectors. Sectoral thicknesses are measured in an elliptical annulus with a vertical outer radius of 2.0 mm and a horizontal radius of 2.4 mm. Deviation map shows the deviation of GCIPL measurements from age-matched healthy controls, shown as red (less 1% probability), yellow (1–5% probability), green (5–95% probability), and white (more than 95% probability). Cross-sectional scans at the level of fovea shows the segmentation of GCIPL. The outer border of the RNFL (retinal nerve fiber layer) is presented as a solid purple line and the outer border of the IPL is presented as a solid yellow line.

