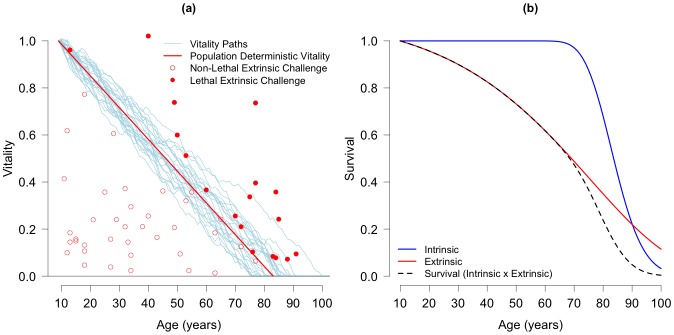
Fig 2. Two-process Vitality Model Illustrated.
(a) The intersection of individual stochastically declining vitality paths (light blue lines) with the zero boundary marks intrinsic death. Extrinsic death occurs when a challenge (filled, red circles) exceeds the deterministic population vitality (red line). (b) shows the two-process vitality model in terms of age-specific survival proportions. Intrinsic survival (blue line) remains at 1 until later ages and extrinsic challenges dominate mortality in early life as shown with the extrinsic survival function (red line). The total survival curve is shown with a dashed, black line and is the product of the intrinsic and extrinsic survival functions as shown in Eq 1. Both figures produced with parameter values: r = 0.0135; s = 0.0126; λ = 0.0449; β = 0.3999.

