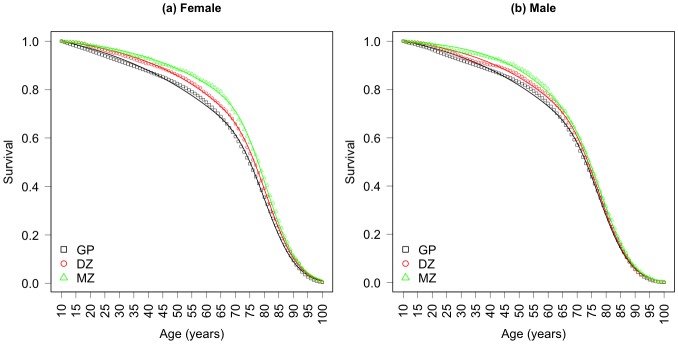
Fig 4. Cumulative survival data and model fit.
Cumualtive survival data (plotting symbols) by zygosity and sex for the 1870–1900 Danish twin cohorts and the 1870–1900 Danish general population cohort. Smooth line through each set of survival data is the model fit. GP: general population, DZ: dizygotic, MZ: monozygotic.

