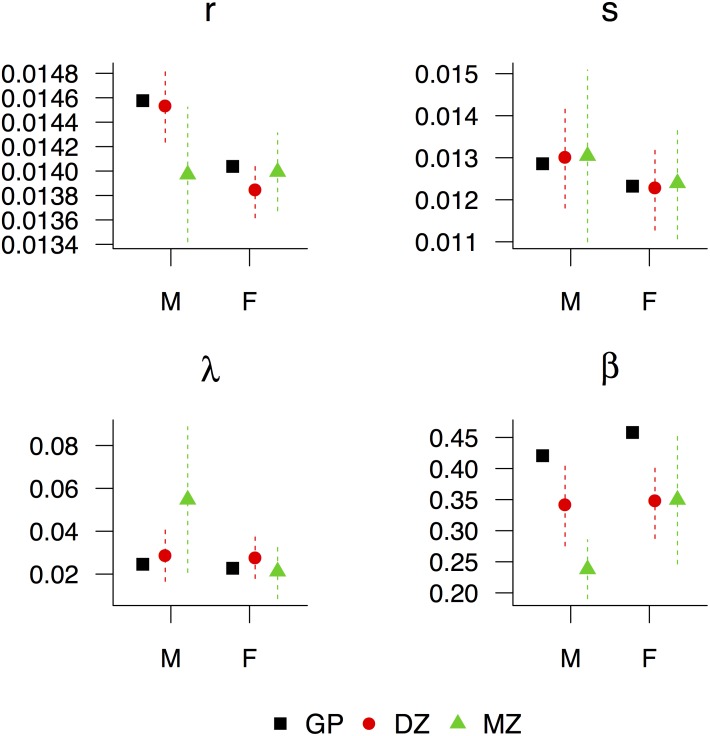
Fig 5. Bias corrected vitality parameters.
Bias corrected vitality parameters by zygosity and sex for the 1870–1900 Danish twin cohorts and 1870–1900 Danish general population cohort. The vertical, dashed lines represent uncertainty intervals as +/- 2*standard error. GP: general population, DZ: dizygotic, MZ: monozygotic, M: male, F: female.

