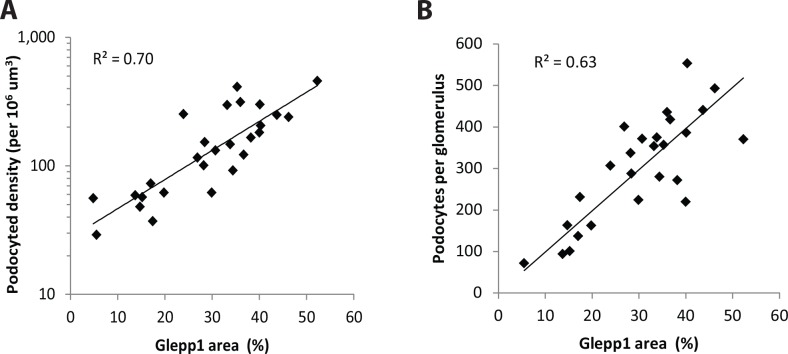
Fig 2. Comparison of two methods for measuring podocyte density.
Panel A. Log podocyte density plotted versus Glepp1 area (%). The two methods correlate with R2 = 0.70. Panel B. Podocyte density x glomerular volume gives the podocyte number per tuft. This value also correlates well with Glepp1 area (R2 = 0.63). Bland-Altman comparison of podocyte density and podocyte number per glomerulus shows a mean difference of 106 (95% confidence interval of 115 to 327), and the Pitman’s test of difference in variance reveals r = 0.072, p = 0.728 indicating comparable results.

