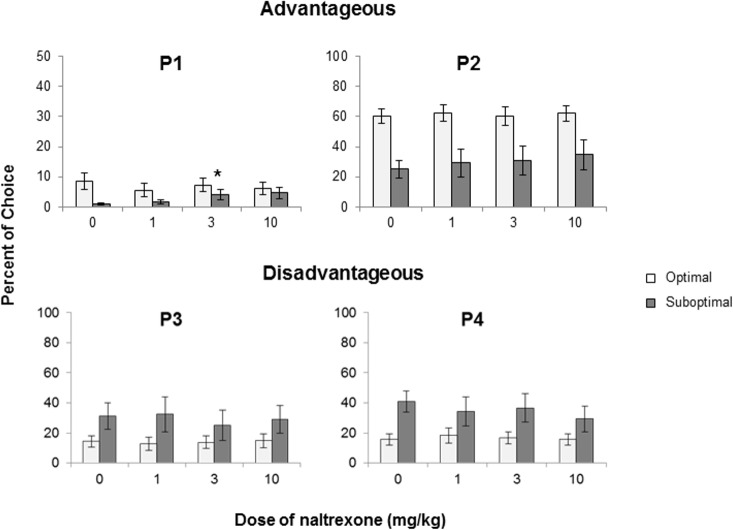
Fig 1.
Mean + SEM percent choice of the P1 (top left panel), P2 (top right panel), P3 (bottom left panel) and P4 (bottom right panel) options. Data are presented for the Optimal (n = 15; open bars) and Suboptimal (dark bars, n-9) groups. Dose X Group ANOVAs revealed a significant interaction for P1 (F(3, 66) = 3.256, pGG = 0.047). *significant t-tests after correction for multiple comparisons.

