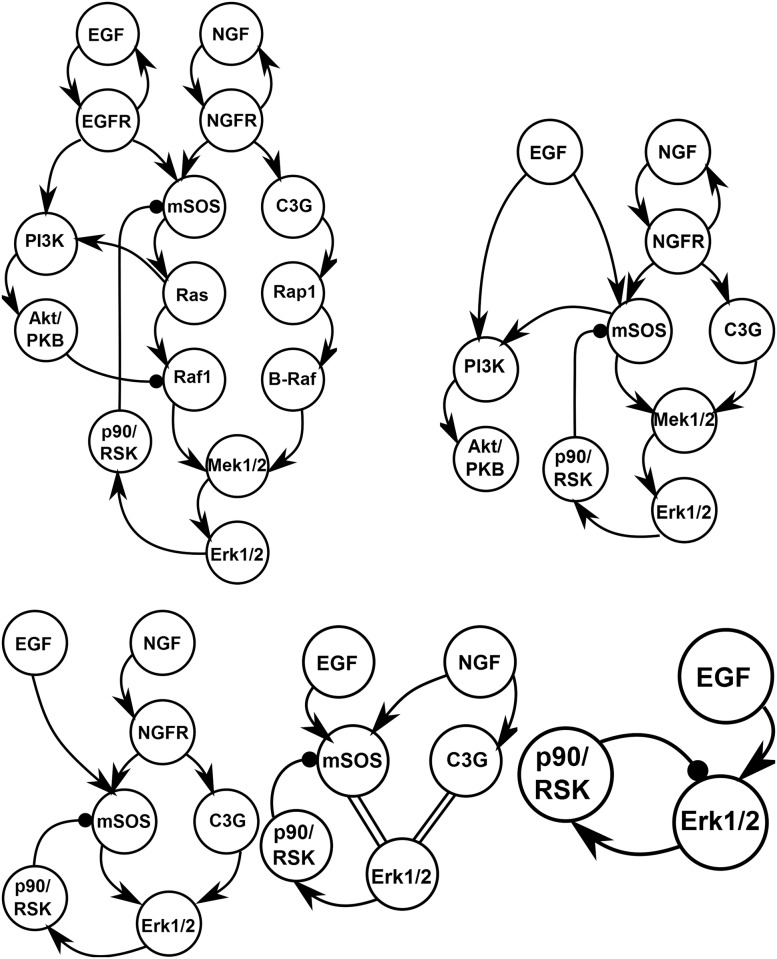
Fig 10. EGFR network condensation for each choice of QoI.
By coarsening the QoIs, MBAM gives models with fewer identifiable parameters as in Fig 9 that condense the full network into an effective, minimal, topology. Top, left: The full topology of the original model. Top, right: The reduced topology that can explain the time series of all biochemical species. Bottom, left: The minimal topology for explaining the data in reference [7]. Bottom, center: The minimal topology for explaining only the input/output relations of the network. Double lines represent algebraic relationships between nodes. Bottom, right: Considering only the adaptive response to EGF stimulus recovers the minimal negative feedback motif in Fig 6.

