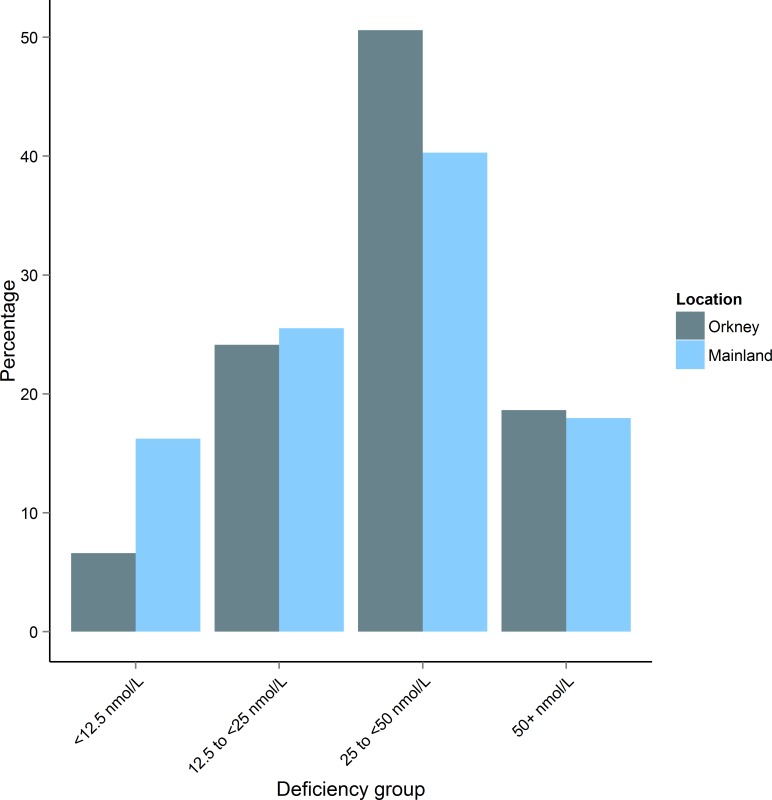
Fig 4. Comparison of percentage of people in May-adjusted vitamin D deficiency groups by location.
The main differences occur in the severely deficient group (<12.5 nmol/L) which has significantly fewer people from the Orkney sample (χ2(1) = 64.2, p = 1.10 x 10⁻¹⁵), and the ‘at risk’ category (25-<50 nmol/L) which has significantly fewer people from the mainland Scottish sample (χ2(1) = 30.3, p = 3.78 x 10⁻⁸).

