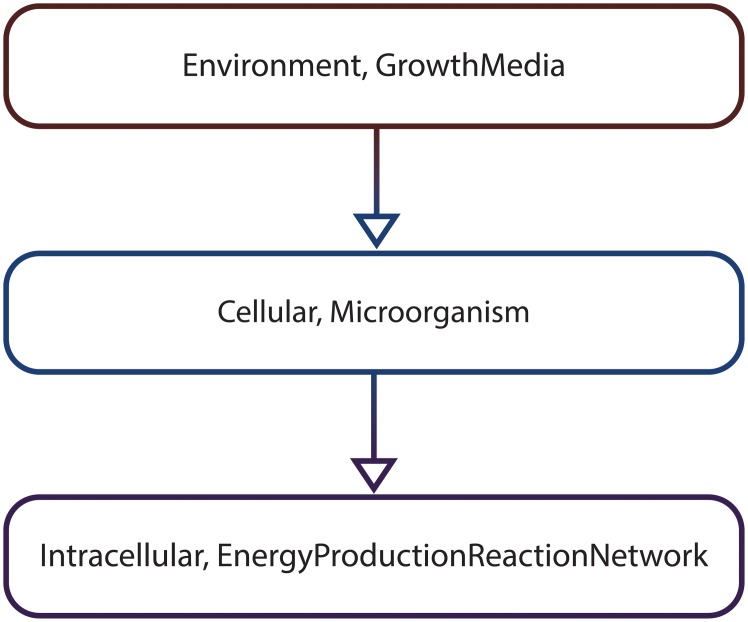
Fig 4. The multiscale architecture graph corresponding to the simple illustrative MSSpDES example.
Each vertex in the graph (e.g. (Environment, GrowthMedia)) corresponds to a subsystem (e.g. growth media) and its associated scale (e.g. environment). Directed edges between vertices (e.g. ((Environment, GrowthMedia), (Cellular, Microorganism))) indicate how one subsystem from a coarse-grained scale (e.g. (Environment, GrowthMedia)) can be decomposed in one or multiple subsystems from more fine-grained scales (e.g. (Cellular, Microorganism)).

