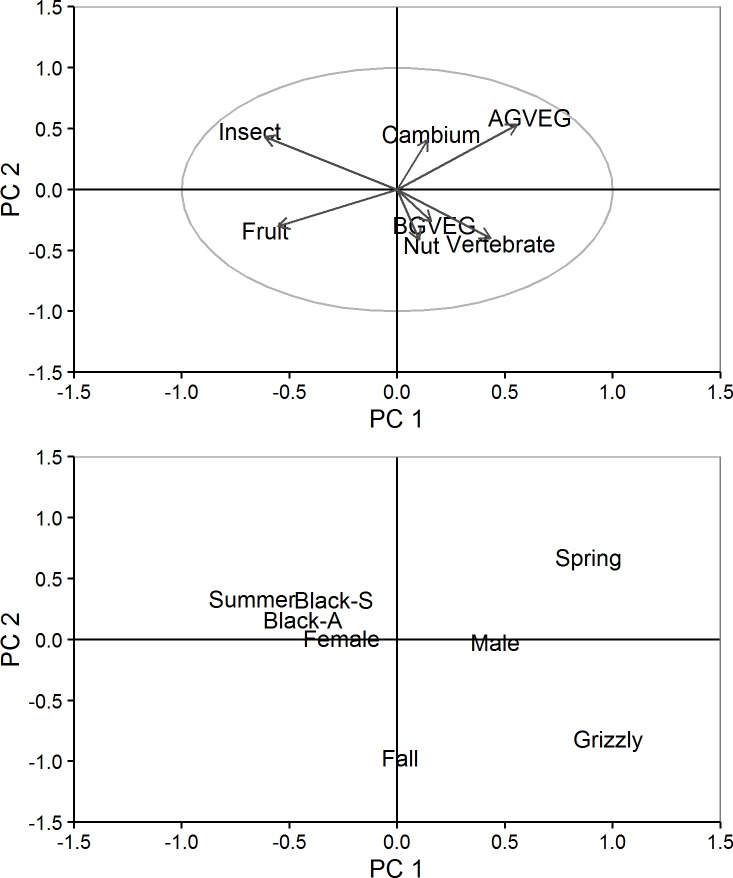
Fig 2. Scatter plots of the first two principal components (PC) constructed from daily diets of grizzly and black bears, Grand Teton National Park and vicinity, Wyoming, USA, 2004–2006.
Top graph illustrates active variables, which were the daily percentages of total energy obtained from 7 food types (e.g., above-ground vegetation [AGVEG], below-ground vegetations [BGVEG]). Bottom graph illustrates supplementary variables of species (grizzly, sympatric black [black-S], allopatric black [black-A]), sex, and season (spring [1 May–30 Jun], summer [1 Jul–20 Aug], fall [21 Aug–31 Oct]).

