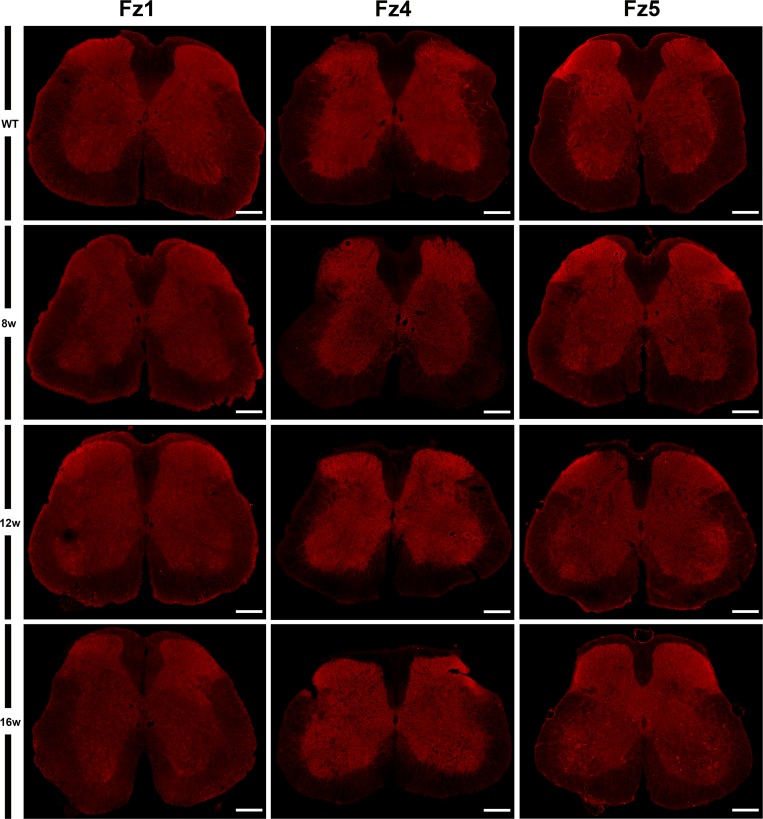
Fig 2. Protein expression of Fz1, Fz4 and Fz5 receptors in the spinal cord of both WT and ALS transgenic mice.
This figure shows representative images obtained from the microscopic evaluation of sections processed by simple immunofluorescence to visualize Fz2, Fz4 and Fz5. Fz1 and Fz4 receptors do not undergo changes in their cellular expression pattern during disease progression. Instead, Fz5 immunoreactivity begins to increase at 12w in some cells, and clearly observed at 16w. The analysis was performed in WT and ALS mice spinal cords at 8w, 12w and 16w. Scale bars = 200 μm.

