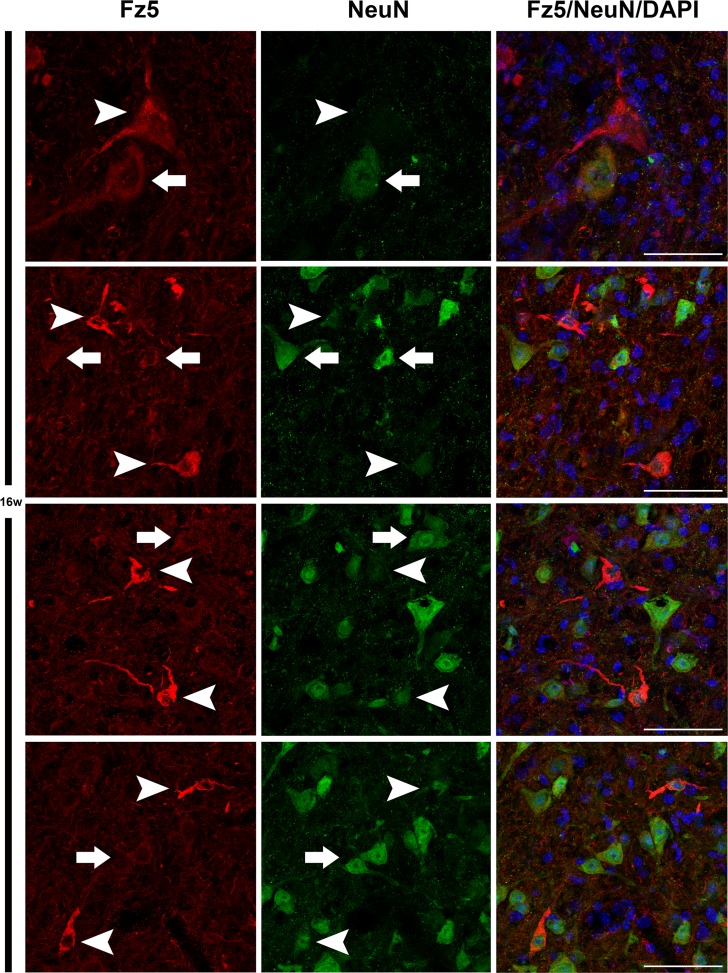
Fig 4. Increased expression of Fz5 receptor matched with a decrease in NeuN immunoreactivity at 16w.
This figure shows representative images obtained from the microscopic evaluation of sections processed by double immunohistochemistry to visualize Fz5 in neurons (NeuN). Cells with increased immunoreactivity for Fz5 showed low levels of NeuN staining (arrowheads). However, neurons with a baseline of Fz5 immunoreactivity exhibited normal NeuN expression (arrows). The analysis was performed in 16 ALS mice spinal cords. Scale bars = 50 μm.

