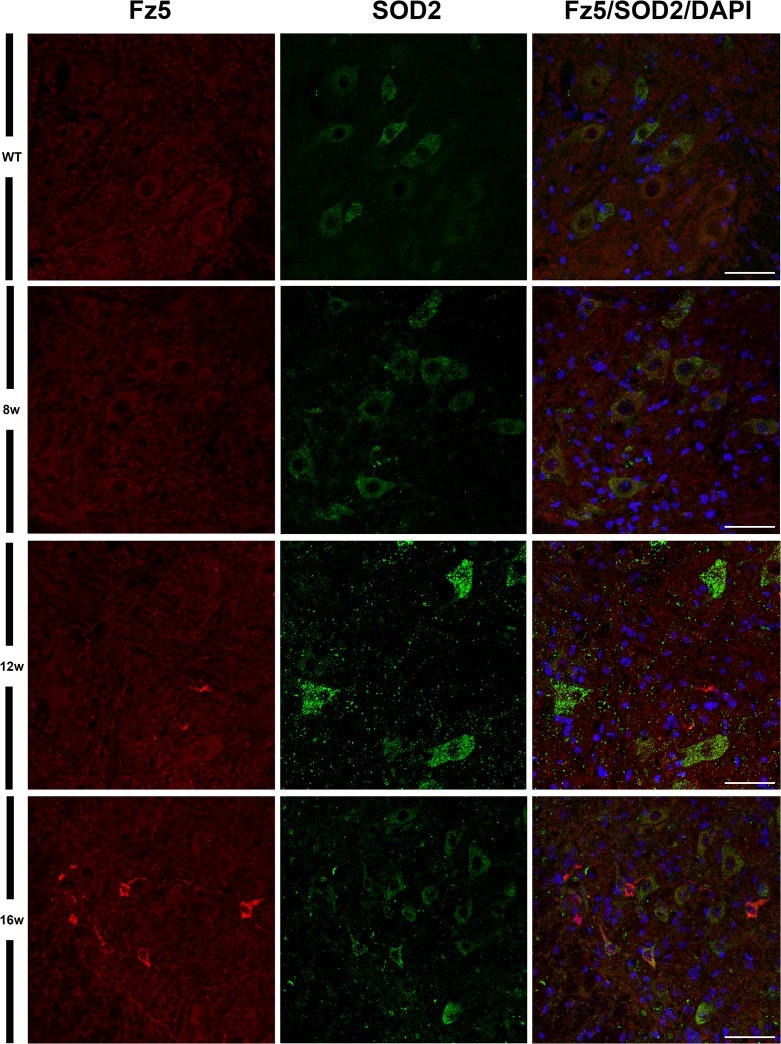
Fig 7. Location of Fz5 receptor and the mitochondrial enzyme SOD2.
This figure shows representative images obtained from the microscopic evaluation of sections processed by double immunohistochemistry to visualize Fz5 and mitochondrial enzyme SOD2. We did not observe a correlation between increased immunoreactivity of Fz5 and SOD2 in these neuronal cells, but an increase of SOD2 signal with the progression of the disease was observed. The analysis was performed in WT and ALS mice spinal cords at 8w, 12w and 16w. Scale bars = 50 μm.

