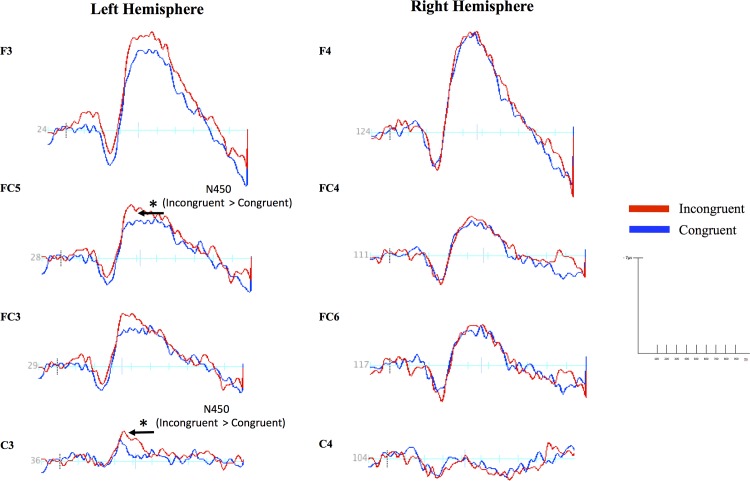
Fig 3. Electrocortical responses differed by Stroop condition in the left hemisphere.
Average event-related brain potential (ERP) waveforms (in microvolts) for incongruent (red lines) and congruent trials (blue lines) at all locations. Asterisks (*) denote statistical differences between incongruent and congruent trials for the N450 ERP with a significance level at p < .01, while arrows with (t) indicate a trend at p < 0.10.

