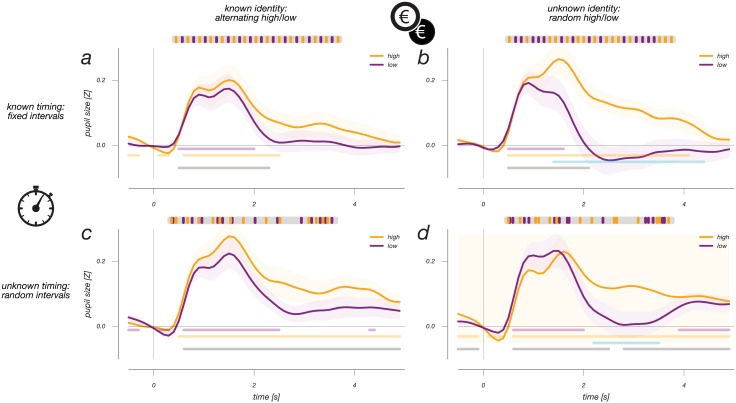
Fig 1. Finite impulse response curves for auditory events in each of the four experimental conditions.
Cartoons above show, for each panel, an example time course of the occurrence of the two types of sound over time. All events elicit a transient and fast positive pupil response. Only in the conditions in which the identity of the sound was unpredictable (panels b&d), was there a difference in pupil response between the two sounds. Interestingly, this response difference occurs later in time, relative to the positive event occurrence response that all sounds share. Error regions indicate +/- standard error of the mean in all figures. Horizontal lines indicate, for each of the event types, the periods of significant difference from zero. Cyan lines indicate a significant difference between the two plotted lines, gray lines indicate significant difference between 0 and the mean of the two responses.

