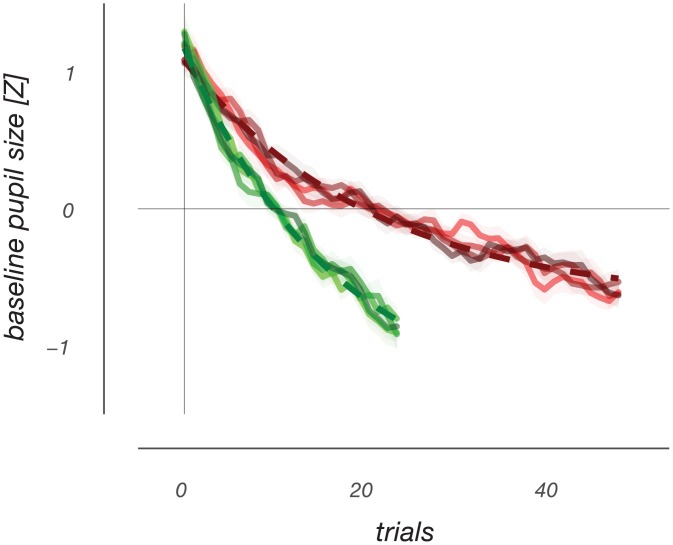
Fig 6. Slow exponential decrease of tonic pupil size over time.
During a single run, tonic pupil size starts high and falls over the course of the run. Two experimental versions had different amounts of trials per recording run and are plotted in different colors. For the red line, trials had an average duration of 3 s, whereas for the green line the average trial duration was 5 s. The different lines per experimental version depict the tonic pupil timecourse for the different experimental conditions, ordered as in Fig 6, and show no difference between conditions. The dashed lines are best- fitting exponential curves. When accounting for the difference in average trial duration, the time constants of these fits are roughly similar, with a slight ~20% difference.

