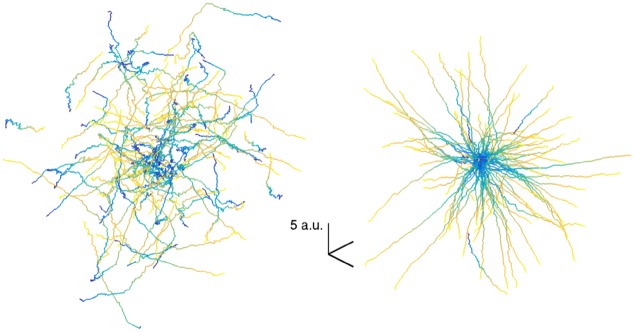
Fig 3. Left panel is a visualization of 100 3D reach trajectories for a poorly-performing initial decoder (trained on 1 reach).
Right panel visualizes 100 trajectories for a well-performing decoder fit from 20 reaches (approximately at performance saturation for this level of noise). Each trajectory is depicted with yellow corresponding to initial trial time and blue corresponding to end of trial (time normalized to take into account different reach durations). The goals were in random locations, so to superimpose the set of traces, all positions have been shifted relative to the goal such that goal is always centered. Observe that the initial decoder is essentially random and the learned decoder permits the performance of reaches which mostly proceed directly towards the goal (modulo variability inherited from the neural noise). Units here relate to those in Fig 2—here referring to position as compared with MSE of corresponding velocity units.

