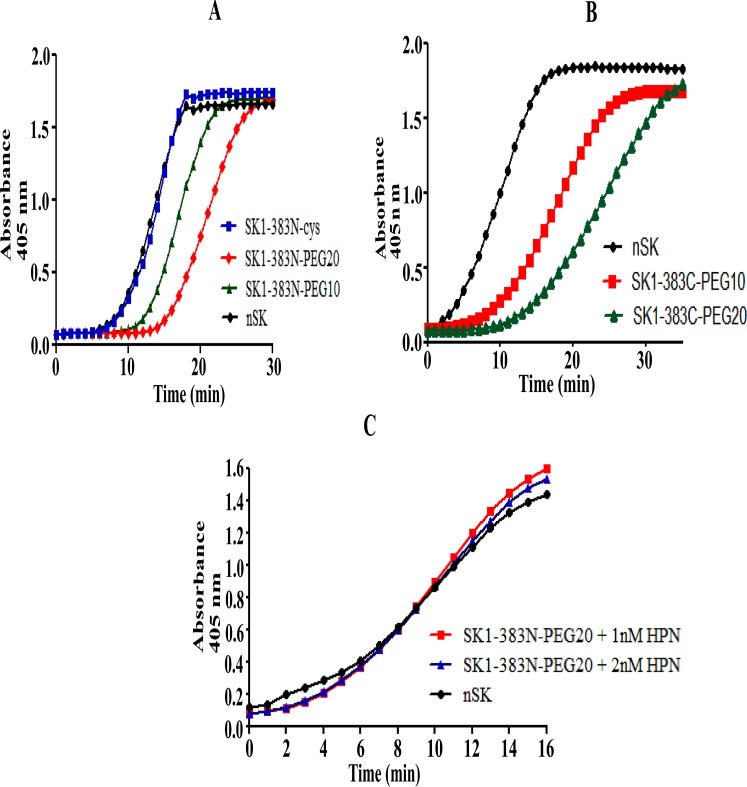
Fig 3. Depiction of time-course activation of HPG by nSK, truncated SK and PEGylated SK and PN-dependency of PEG-SK derivatives for the activation of HPG.
(A) nSK/truncated SK/PEGylated-SK (0.5 nM conc. each) were added separately in microtiter plate wells, containing HPG and chromozyme® PL. The progress curves of activation of HPG were measured spectrophotometrically at 405nm over time. The graph shows nSK (black color circles)SK1-383N-cys (blue rectangles), SK1-383N-PEG10 (green triangles), SK1-383N-PEG20 (red diamonds). (B) Graph represents activation of HPG by nSK/SK1-383C-PEG derivatives at 1 nM conc. each in the assay. nSK (black circles), SK1-383C-PEG10 (red rectangles), SK1-383C-PEG20 (green triangles). (C) Plasmin (1 nM or 2 nM) was incubated in a well containing nSK/truncated PEG-SK derivative, HPG and chromozyme ® PL. Graph depicts native SK (black circles), SK1-383N-PEG20 containing 1 nM HPN (red rectangles), SK1-383N-PEG20 containing 2 nM HPN (blue triangles). Statistical analysis showed significant difference (p-value < 0.0001, n = 10, one-way ANOVA test).

