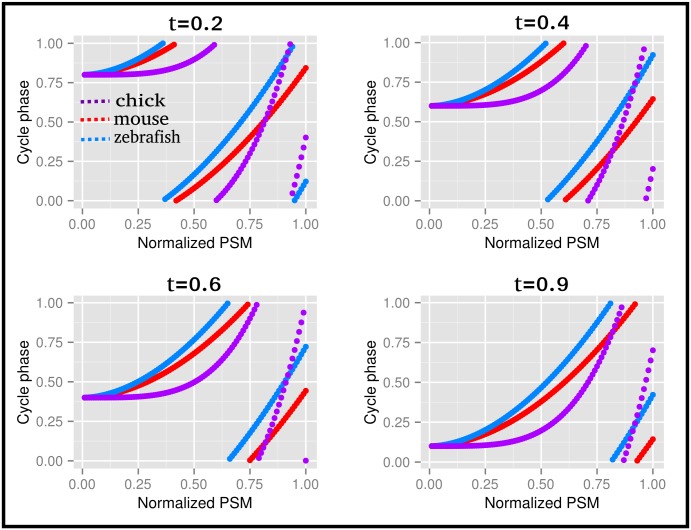
Fig 7. Relationship between the phase of gene expression and position along the PSM of the chicken, mouse and zebrafish embryos.
The waves start as moving fast for small values of x (most posterior part of the PSM), and slow down as the wave progresses toward larger values of x. The four snapshots depict a sequence of time-points, corresponding to different phases of the somite cycle.

