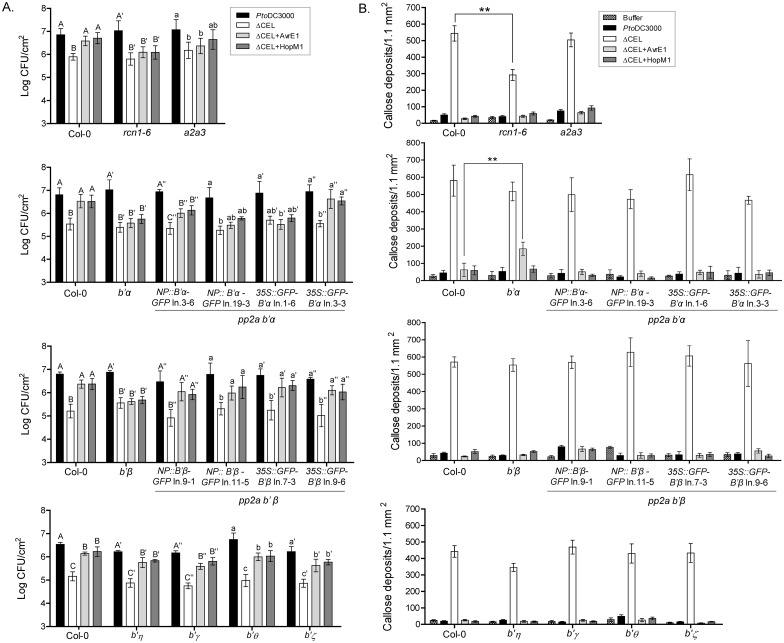
Fig 5. Specific PP2A B’ subunits are required for virulence activities of AvrE1 and HopM1 in Arabidopsis leaves.
(A) Growth analysis in 5-week-old Arabidopsis plants, including PP2A mutants and complementation lines, at 4 days after infiltration of 105 CFU/ml of Pto DC3000, ΔCEL, ΔCEL+AvrE1, and ΔCEL+HopM1. Values shown are mean ± SEM from four biological replicates for A subunit and b’η, γ, θ, and ζ mutants, from three biological replicates for complementation lines, and from at least six biological replicates for α and β mutants. The inability of NP::α-GFP ln.19-3 and 35S::GFP-α ln. 1–6 to complement T3E-promoted bacterial growth may result from an adverse effect of too high and too low α transcript level, respectively (S8 Fig). Data was analyzed by one-way ANOVA followed by the Tukey test comparing different bacterial strains on individual plant genotypes. Different letters of the same style (eg. A vs B, or A’ vs B’) indicate significant differences at P<0.05 within the same plant genotype. (B) Suppression of Pto ΔCEL-induced callose deposition by AvrE1 depends on the PP2A B’α subunit. rcn1-6 showed reduced callose deposition in response to ΔCEL infection. Leaves of five-week-old Arabidopsis plants were infiltrated with the indicated bacterial strains (108 CFU/ml) or buffer (10 mM MgCl2), and collected at 16 hai for callose staining. Values shown are mean ± SEM from 3–5 biological replicates with Col-0 included in each individual experiment. ** indicates a significant difference by Student’s t-test at P<0.01.

