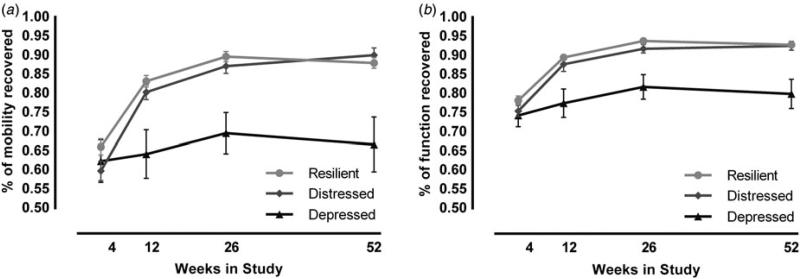
Fig. 2.
Depressed trajectory associated with poorer mobility and functional recovery. Assessment of whether participants returned to pre-fracture functioning was estimated as the percent recovered at each time point relative to pre-fracture scores [(follow-up week/pre-fracture) × 100]. Both percent of (a) mobility recovered and (b) total functional recovery indicated significant differences between the depressed and resilient groups at weeks 12, 26, and 52. Figures display means with standard error bars for each time point.

