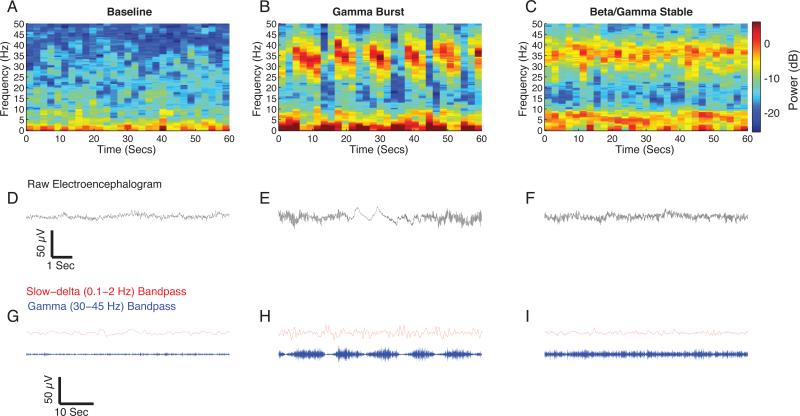
Figure 1.
Representative spectrogram and time-domain traces of baseline and ketamine-induced EEG signatures. A. Baseline spectrogram with a relative lack of power concentrated in any frequency band. B. Gamma burst spectrogram with power concentrated in slow-delta, theta, and gamma frequency bands. The increased gamma power can be observed to occur in a rhythmic pattern that alternates with slow-delta oscillations. C. Beta/gamma stable spectrogram with power concentrated in theta and gamma frequency bands. The gamma pattern does not demonstrate an appreciable rhythmicity. D. Representative 10 second raw EEG trace from panel A. E. Representative10 second raw EEG trace from panel B illustrating the alternating slow-delta oscillation and gamma oscillation pattern. F. Representative10 second raw EEG trace from panel C illustrating the stable gamma pattern. G. Representative 55 second slow (red) and gamma (blue) band passed filtered EEG trace from panel A. H. Representative 55 second slow and gamma band passed filtered EEG trace from panel B. Compared to baseline, the gamma burst pattern is visually evident. I. Representative 55 second slow (red) and gamma (blue) band passed filtered EEG trace from panel C. Compared to gamma burst, the gamma pattern is not rhythmic.
dB = decibel; Hz = hertz.

