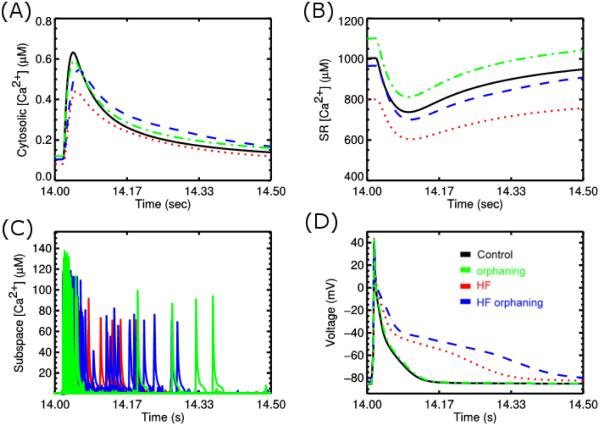
Figure 4.
Simulation with sticky cluster model incorporated into model for excitation-contraction coupling in the rat ventricular myocyte to explore heart failure. In the panes black = control, green = orphaning – T-tubular rearrangement, red = changes in gene expression and post-translational modification with heart failure blue = red + T-tubular rearrangement, and (A) Cytosolic [Ca2+], (B) SR [Ca2+], (C), subspace [Ca2+]ds, (D) Action potential.

