Figure 6.

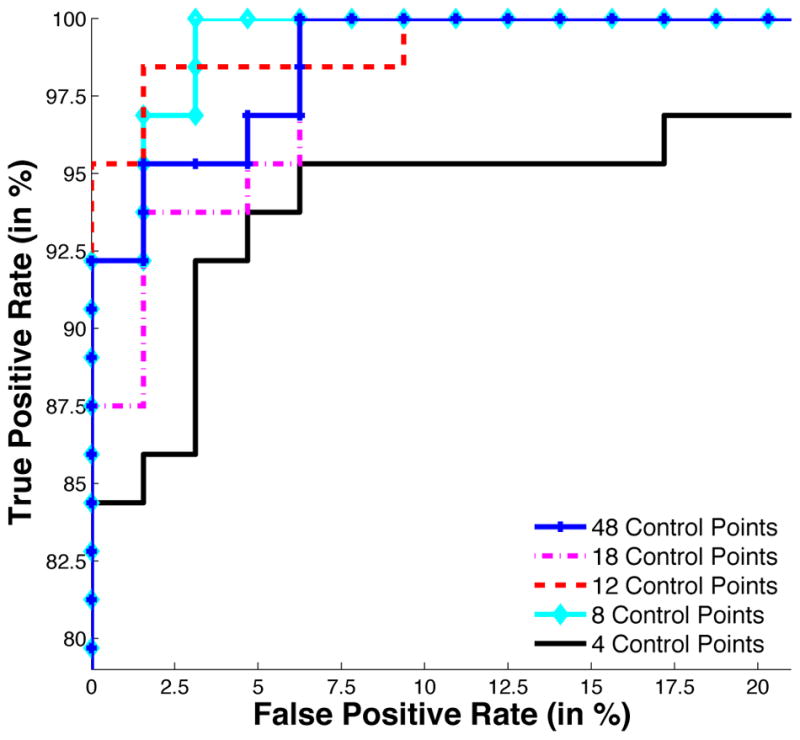
ROC curves for hippocampus classification using a different number of control points in the atlas and ML classifier. Atlases with 48 and 18 control points exhibit poorer performance than those with 12 and 8 control points.

ROC curves for hippocampus classification using a different number of control points in the atlas and ML classifier. Atlases with 48 and 18 control points exhibit poorer performance than those with 12 and 8 control points.