
Figure 3.
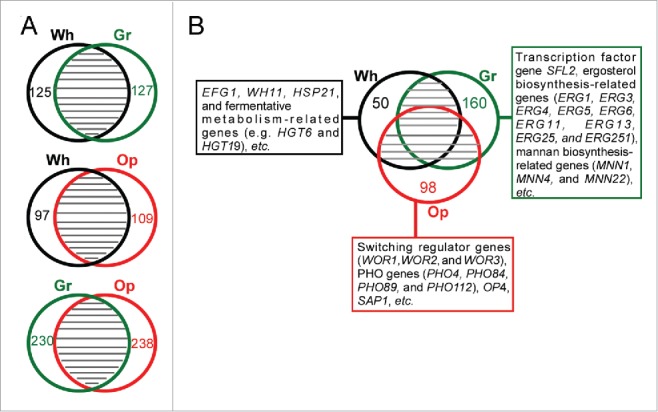
Global gene expression profiles in white, gray, and opaque cells of C. dubliniensis. Differentially expressed genes were identified by RNA-Seq analysis using a 2-fold cut-off. Wh, white; Gr, gray; Op, opaque. (A) Venn diagrams of differentially expressed genes between white-gray, white-opaque, and gray-opaque cell types. The numbers of cell type-specific genes are indicated. (B) White-, gray-, and opaque-specific genes.