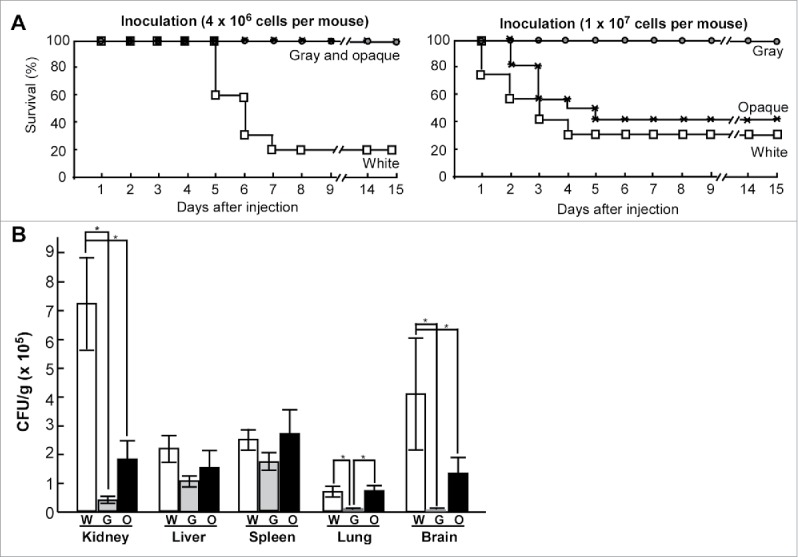
Figure 4.

White, gray, and opaque cells differ in virulence in mouse systemic infections. (A) Survival curves for white, gray, and opaque cells of strain PC35. Each cell type (4 × 10⁶, left, 10 mice used for each cell type; or 1 × 10⁷, right, 12 mice used for each cell type) was injected into each mouse via the tail vein. (B) Fungal burdens of white, gray, and opaque cells in different organs in a mouse systemic infection system. Each cell type (2 × 10⁶ cells in 200 μL of PBS) was injected into each mouse via the tail vein. Six mice were used for each cell type. The mice were killed at 24 hours after injection and 5 organs (liver, kidney, spleen, lung, and brain) were used for the fungal burden assays. The average numbers and standard deviations of the CFU per gram of different tissues are indicated. * indicates significantly difference (P value <0.05, Student's t-test, 2-tailed).
