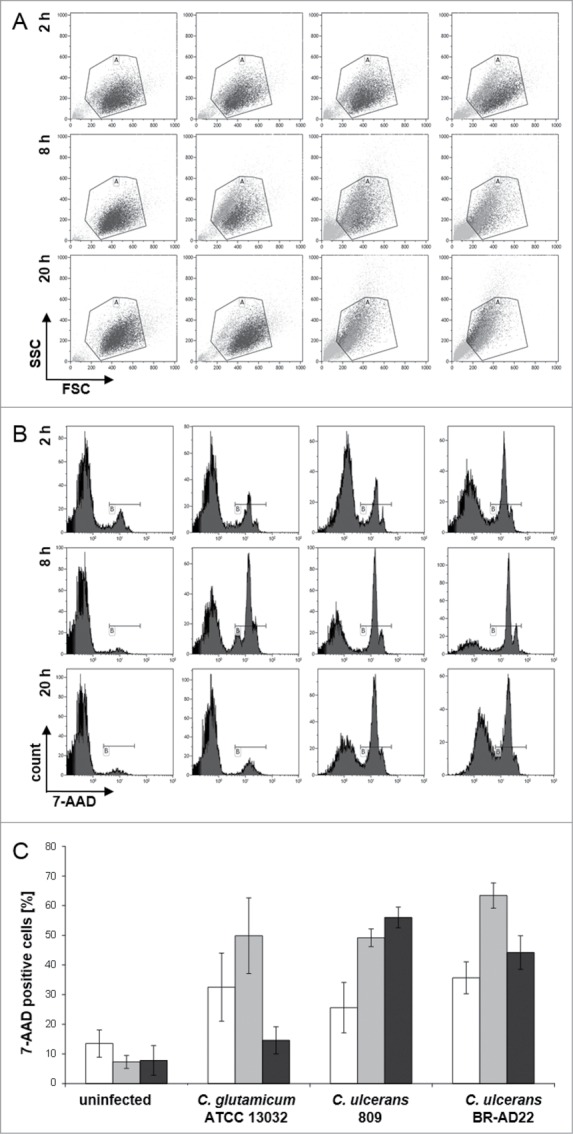
Figure 7.

7-AAD staining and FACS analysis of THP-1 cells infected with C. ulcerans. THP-1 cells were infected with the non-pathogenic C. glutamicum ATCC 13032 and pathogenic C. ulcerans strains 809 and BR-AD22 at MOI 50, uninfected cells were carried along as negative control. After different points in time, cells were harvested and stained with 7-AAD, a dye that only penetrates dead cells, and analyzed by flow cytometry. (A) Dot plots of representative samples show forward scatter versus side scatter. Gate A excludes cell debris and small fragments like bacteria. (B) Histograms (7-AAD signal vs. cell count) of 10,000 cells after gating. Gate B represents 7-AAD positive, dead cells (light gray in gate A). (C) Quantitative analysis of 7-AAD positive cells at 2 (white bars), 8 (gray bars) and 20 h (black bars). Mean values and standard deviations of at least 2 independent assays performed in triplicate are depicted.
