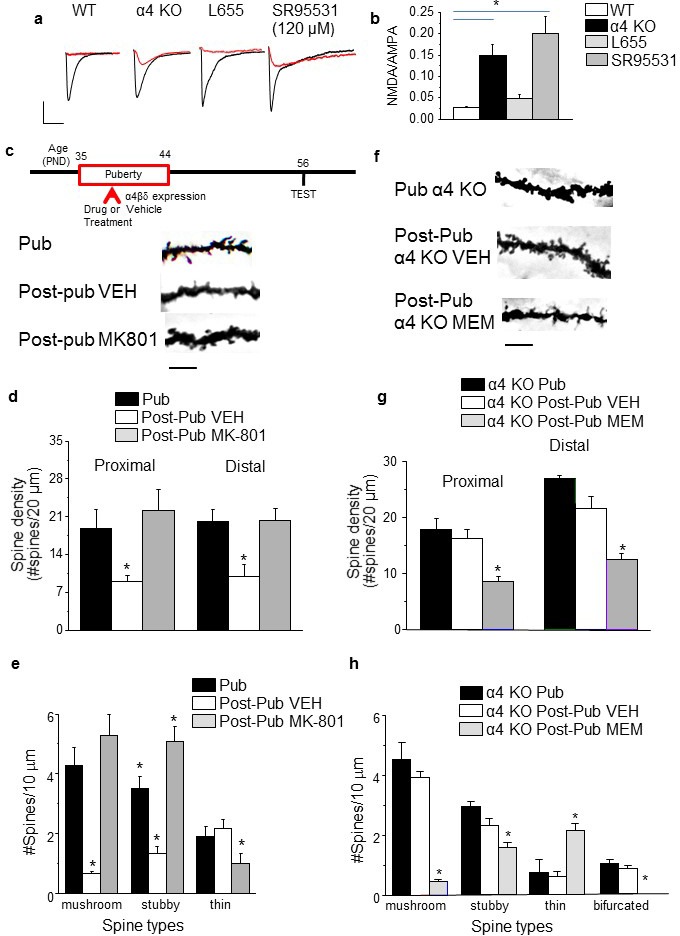
Figure 2. NMDA receptors maintain spines during puberty.

(a) Representative EPSCs (black) and NMDA EPSCs (red) recorded during puberty in WT or α4 KO hippocampus, in some cases during α5 (50 nM L655) or total (120 μM SR95531) GABAR blockade. In all other cases, 200 nM SR95531 was bath applied block synaptic GABARs (Stell and Mody, 2002). Scale, 150 pA, 15 ms. (b) Averaged NMDA/AMPA ratios; ANOVA, F(3,31)=20.21, p=0.0001*, power=1; n=8–10 cells (mice)/group. (Figure 2—source data 1) *p<0.05 vs. WT. (c) Inset, Drug treatment during puberty (PND 35–44) was tested for its effect on post-pubertal spine density (PND 56). Z-stack images, pub and post-pub hippocampus, showing the effects of pubertal vehicle or MK-801 treatment, at a dose shown to increase NMDAR expression (Gao and Tamminga, 1995). Scale, 6 μm. (d) Averaged spine density. Proximal (left): ANOVA, F(2,32)=54.16, p<0.0001*, power=1, n= 11–12 neurons (5 mice)/group; Distal (right)l: ANOVA, F(2,32)=460.1, p<0.0001*, power=1; n=11–12 neurons (5 mice)/group. (Figure 2—source data 2) *p<0.05 vs. other groups. (e) Quantification of spine types. Mushroom, ANOVA, F(2,33)=24.7, p<0.0001*; Stubby, ANOVA, F(2,33)=25.4, p<0.0001*; Thin, ANOVA, F(2,33)=7.66, P=0.002*; power=0.9–1; n=12 neurons (6 mice) /group. *p<0.05 vs. other groups. (Figure 2—source data 3) (f) Z-stack images, pub and post-pub hippocampus, showing the effects of pubertal vehicle or memantine (MEM) treatment, a NMDAR blocker which does not alter NMDAR expression (Cole et al., 2013). Scale, 6 μm. (g) Averaged spine density. *Proximal: ANOVA, F(2,54)=64.12, p<0.0001*, power=1, n=17–20 neurons (4–5 mice) /group; Distal: ANOVA, F(2,56)=33.2, p<0.0001*, power=1, n=19–20 neurons (4–5 mice) /group. (Figure 2—source data 4) *p<0.05 vs. other groups. (h) Quantification of spine types. Mushroom, ANOVA, F(2,45)=89.9, p<0.0001*; Stubby, ANOVA, F(2,45)=9.4, P=0.0004*; Thin, ANOVA, F(2,45)=13.7, P=0.0001*; Bifurcated, ANOVA, F(2,45)=17.7, p<0.0001*; power=1, n=16 neurons (4–5 mice)/group. (Figure 2—source data 5) *p<0.05 vs. other groups.
DOI: http://dx.doi.org/10.7554/eLife.15106.012
