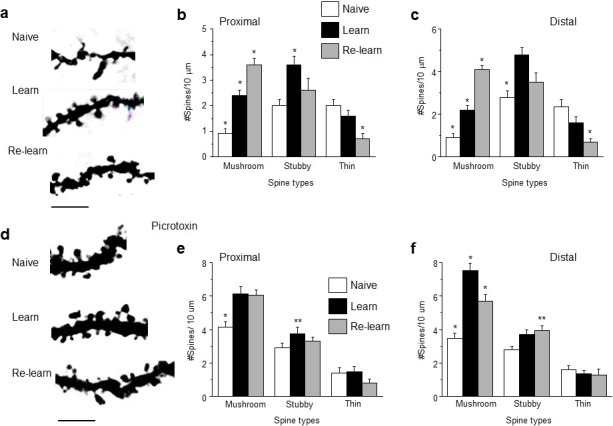
Figure 6. Learning and re-learning increase mushroom-type dendritic spines in CA1 hippocampus following adolescent synaptic pruning.

(a) Representative z-stack images from CA1 hippocampal pyramidal cells illustrating changes in spine type and number after hippocampal-dependent learning and re-learning, compared to naïve conditions. Scale, 5 μm. (b, c) Means ± S.E.M. for proximal and distal dendrites. Proximal, Mushroom, ANOVA, F(2,39)=44.9, p<0.0001*, power=1; Stubby, ANOVA, F(2,39)=6.0, p=0.005*. power=0.86; Thin, ANOVA, F(2,39)=7.24, p=0.004*; power=0.97, n=14 neurons (5 mice)/group. *p<0.05 vs. other groups. Distal, Mushroom, ANOVA, F(2,39)=84.1, p<0.0001*, power=1; Stubby, ANOVA, F(2,39)=13.7, p<0.0001*, power=1; Thin, ANOVA, F(2,39)=13, p<0.0001*; power=1, n=14 neurons (4–6 mice)/group. *p<0.05 vs. other groups. **p<0.05 vs. naïve. (Figure 6—source data 1) (d) Representative z-stack images from hippocampus of adult mice treated during the pubertal period with 3 mg/kg picrotoxin (Figure 3) to prevent synaptic pruning. Changes in spine type and number are evident after hippocampal-dependent learning and re-learning, compared to naïve conditions. Scale, 5 μm. (e,f) Means ± S.E.M. for proximal and distal dendrites. Proximal, Mushroom, ANOVA, F(2,39)=12.6, p<0.0001*, power=0.99; Stubby, ANOVA, F(2,39)=3.78, p=0.03*. power=0.86; Thin, ANOVA, F(2,39)=0.87, p=0.43, n=14 neurons (5 mice)/group. *p<0.05 vs. other groups. **p<0.05 vs. naïve. Distal, Mushroom, ANOVA, F(2,39)=33.1, p<0.0001*, power=1; Stubby, ANOVA, F(2,39)=3.87, p<0.029*, power=1; Thin, ANOVA, F(2,39)=0.42, p=0.66, n=14 neurons (5 mice)/group. *p<0.05 vs. other groups. **p<0.05 vs. naïve. (Figure 6—source data 2)
DOI: http://dx.doi.org/10.7554/eLife.15106.039
