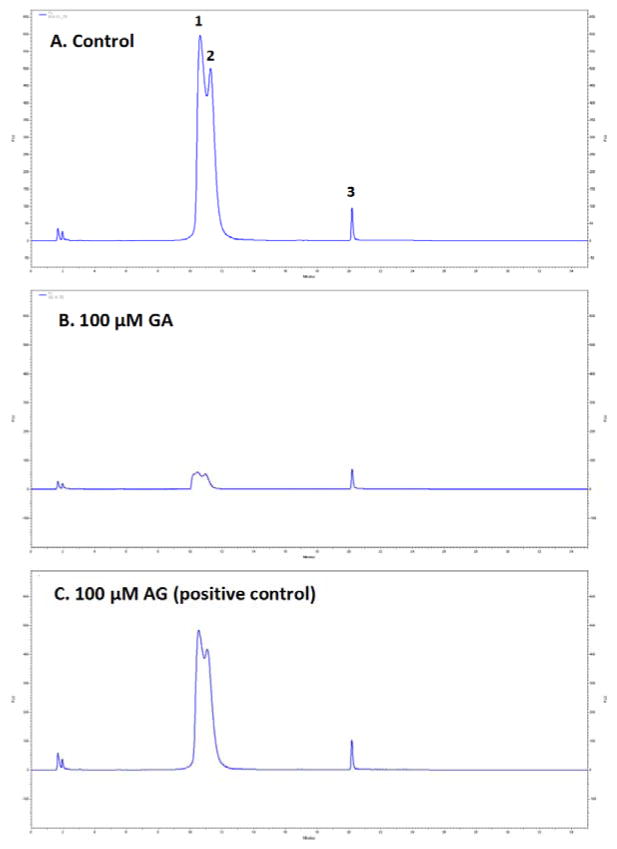
Figure 4.
HPLC-FL profiles of BSA AGEs (peaks 1, 2 and 3) monitored at excitation and emission wavelengths of 340 nm and 435 nm, respectively. Control solution consisted of BSA and D-fructose alone (A) and treatments included 100 μM GA (B) and 100 μM positive control AG (C). The HPLC-FL profile of the blank solution containing BSA only yielded no fluorescence signal suggesting the absence of AGE products in the blank sample (data not shown). Repeated chromatographic analyses of reaction mixtures by HPLC-FL revealed no significant differences in the elution profiles of any of the AGEs peaks in each of the solutions.

