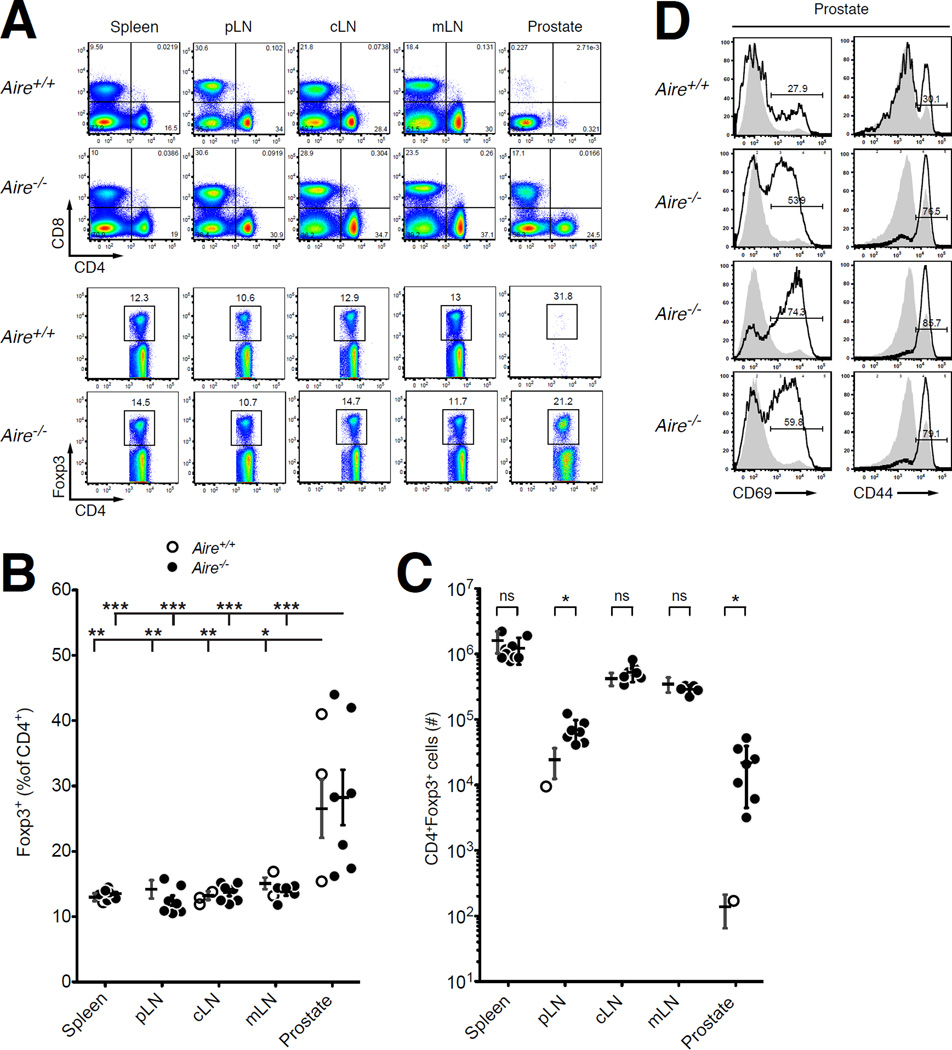
Figure 1. Treg Cells Are Present at Elevated Frequency in the Prostate of Aire−/− Mice.
(A) Representative flow cytometric analyses of 9-week-old Aire+/+ and Aire−/− males on the B6 background. Top, CD8 vs. CD4 expression by T cells isolated from the spleen, lymph nodes, and prostate. Bottom, for the CD4+CD8αneg cells in the top panels, plots of Foxp3 vs. CD4 expression. The percentage of cells falling within the denoted gates is indicated. pLN, periaortic lymph nodes; cLN, cervical lymph nodes; mLN, mesenteric lymph nodes.
(B and C) Summary plots of (B) the percentage of Foxp3+ cells among CD4+ T cells and (C) the total number of CD4+Foxp3+ T cells isolated from the indicated sites of Aire+/+ (open circles) or Aire−/− (closed circles) males depicted in panel A. N = 5 for Aire+/+ samples, N = 5–8 for Aire−/− samples. Data are pooled from N = 2 experiments. The mean +/− SEM is indicated. Asterisks denote P < 0.05. For (B), ANOVA and Tukey’s multiple comparison test were used to compare the different organ sites within Aire+/+ mice and the different organ sites within Aire−/− mice. For (C), t-tests were used to compare Aire+/+ vs. Aire−/− mice at each organ site.
(D) Representative flow cytometric analyses of CD69 and CD44 expression by CD4+ Tconv cells from >9- week-old Aire+/+ and Aire−/− males (indicated). Bold histograms denote CD4+ Tconv cells from the prostate, filled gray histograms denote CD4+ Tconv cells from the spleen. The percentage of cells expressing the indicated markers is shown.

